Our Dashboards
What The Data helps businesses automate repetitive and manual tasks, streamline workflows, and increase operational efficiency. With low-code tools and custom automation solutions, we eliminate bottlenecks and enable your team to focus on what matters most growth and innovation.
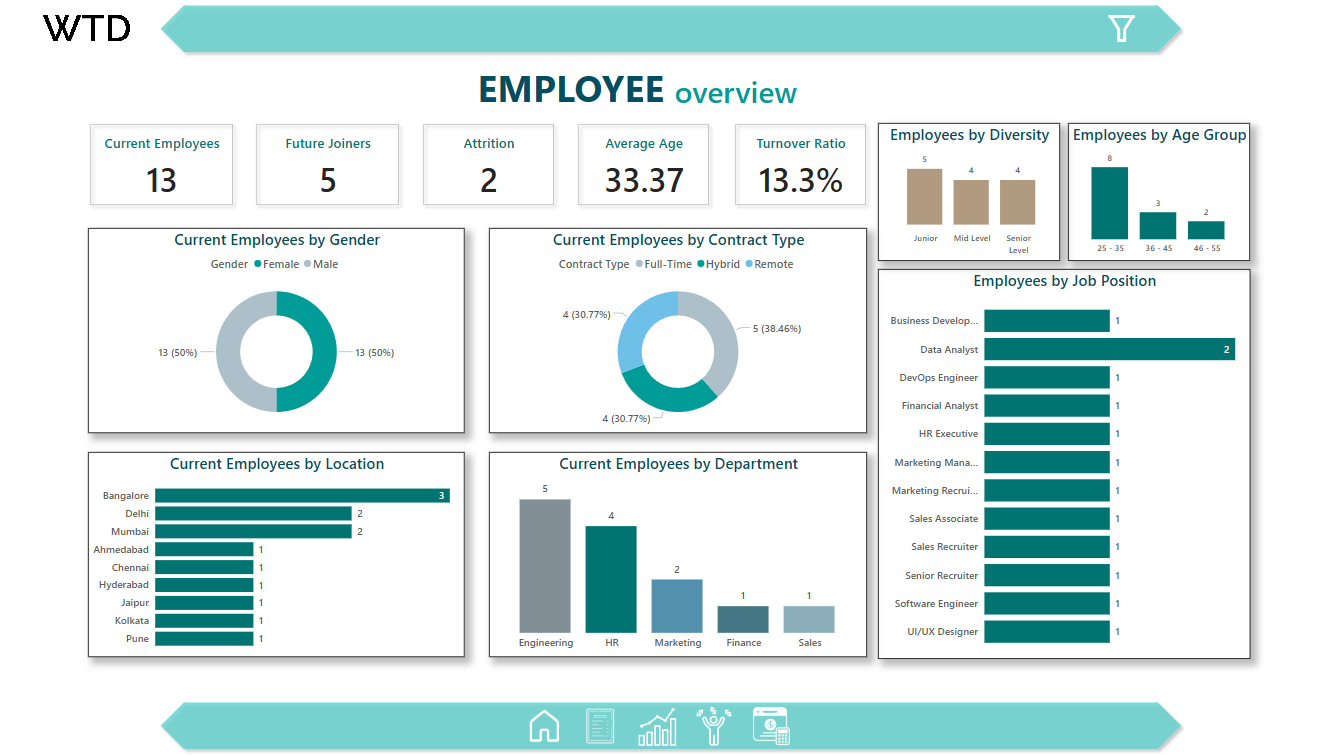
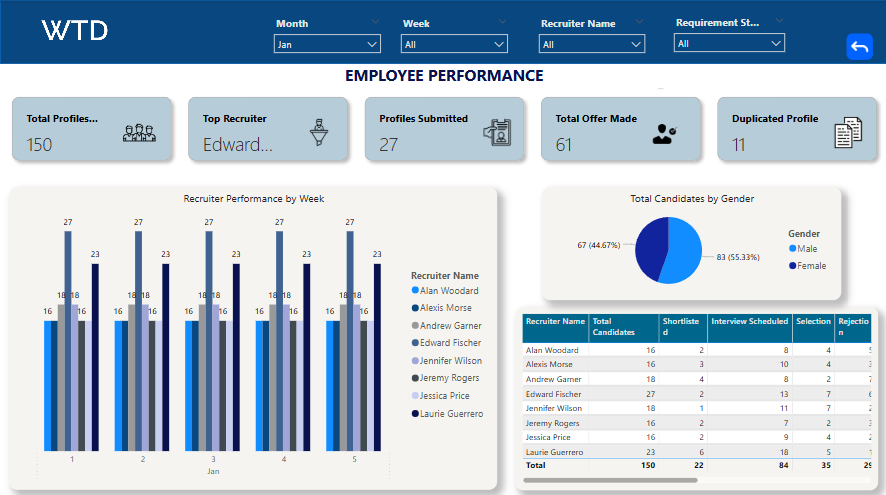
Real-Time Insights
Our dashboards provide real-time data synchronization, enabling decision-makers to monitor KPIs, track performance, and act instantly based on the latest information.
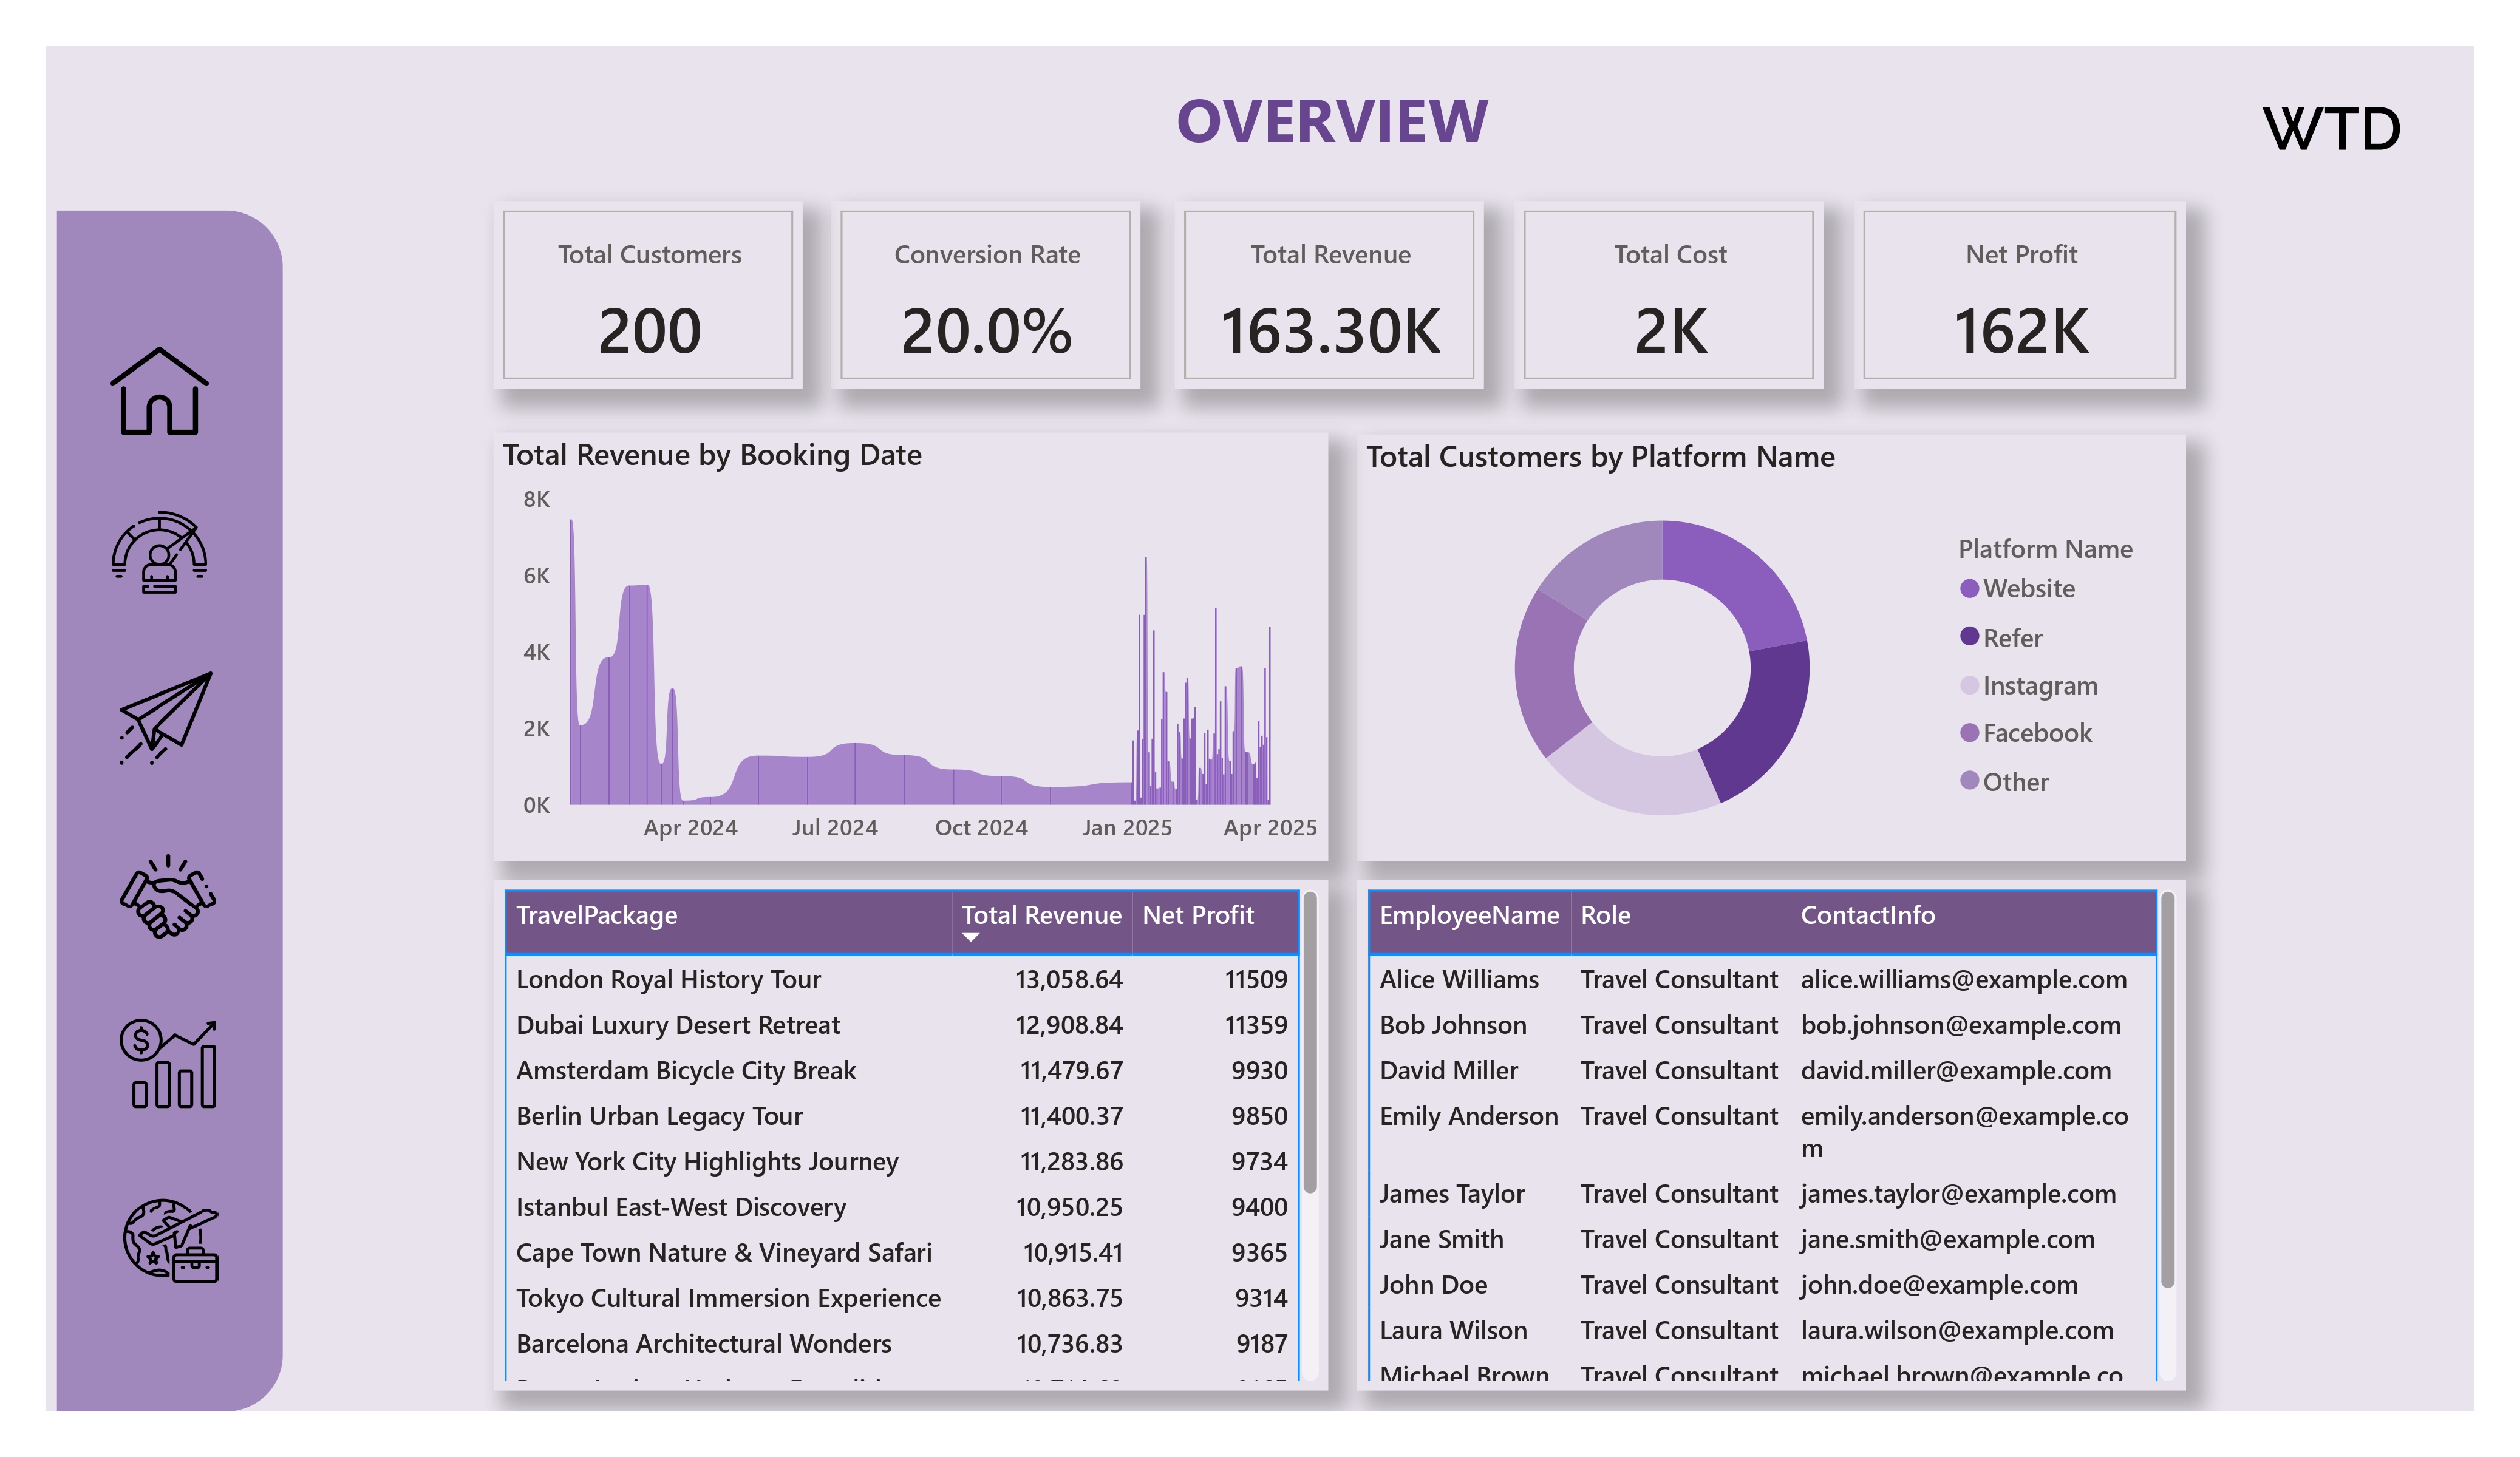
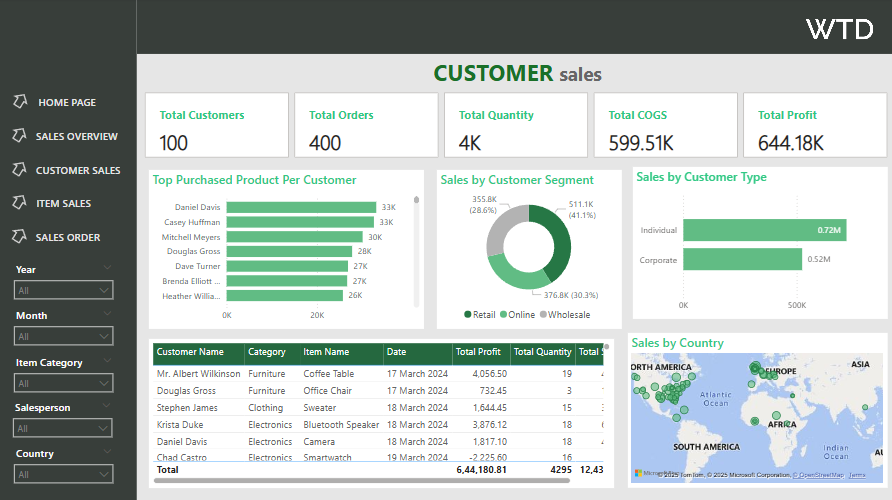
Customizable Modules
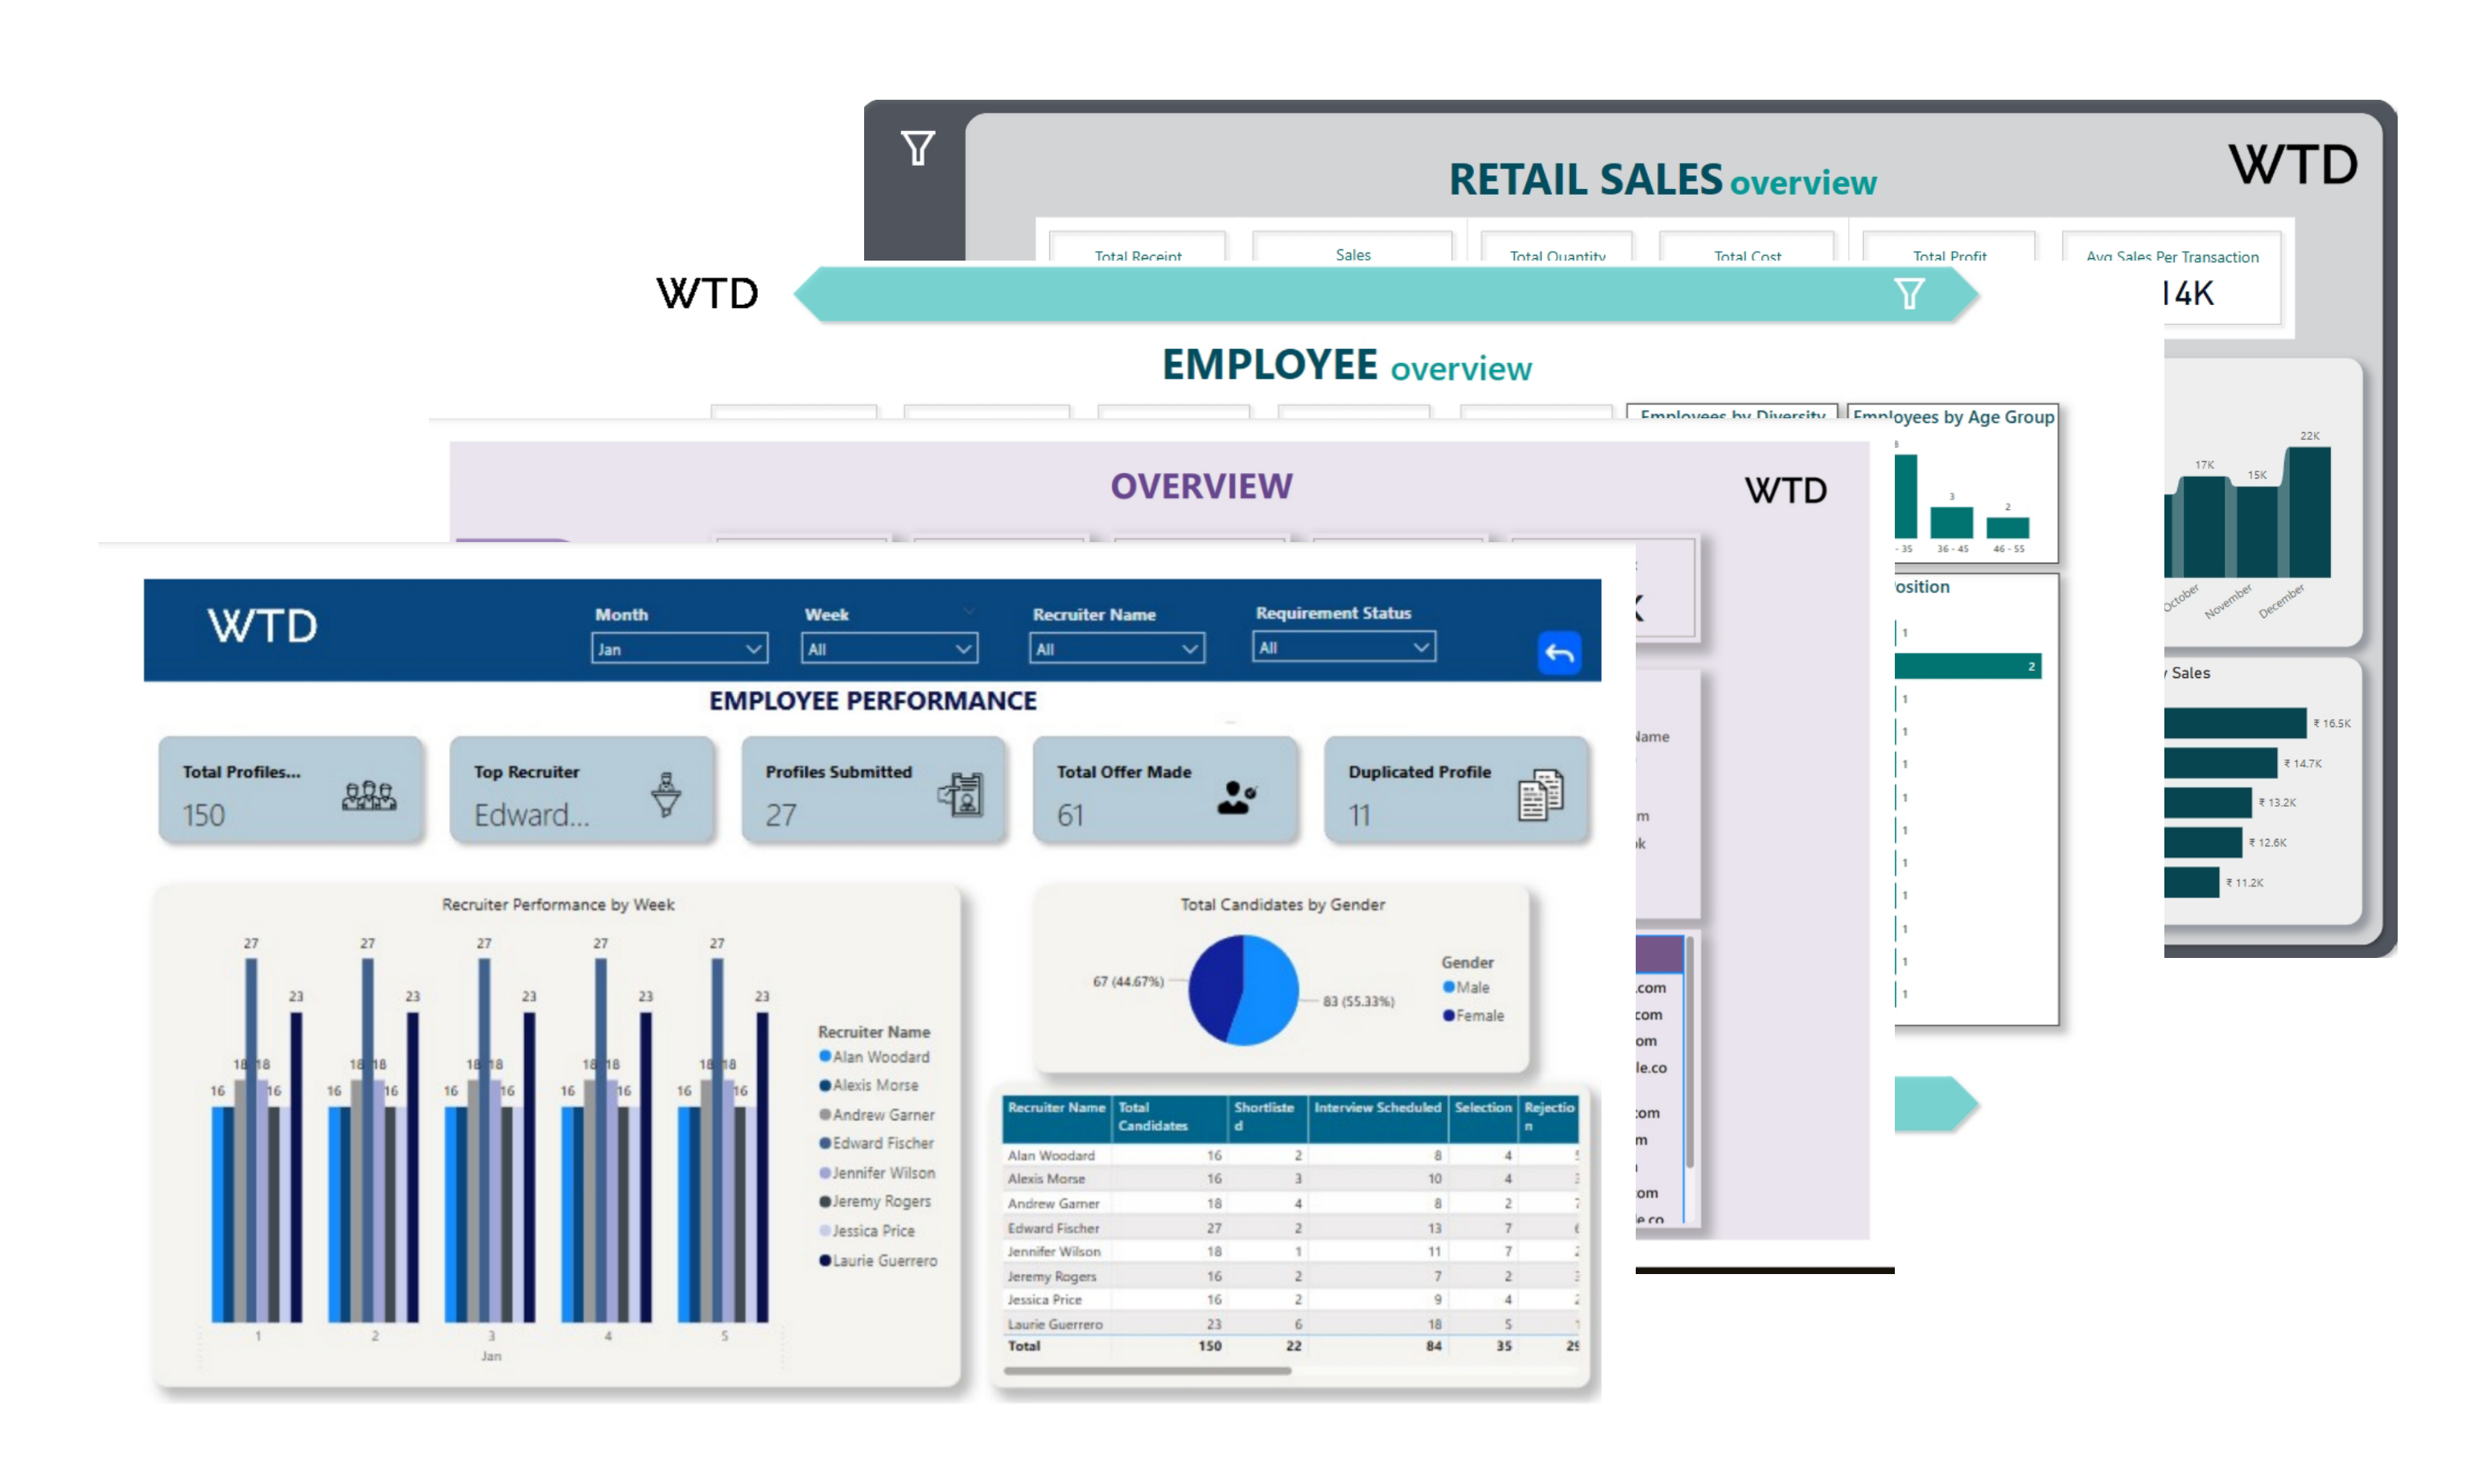
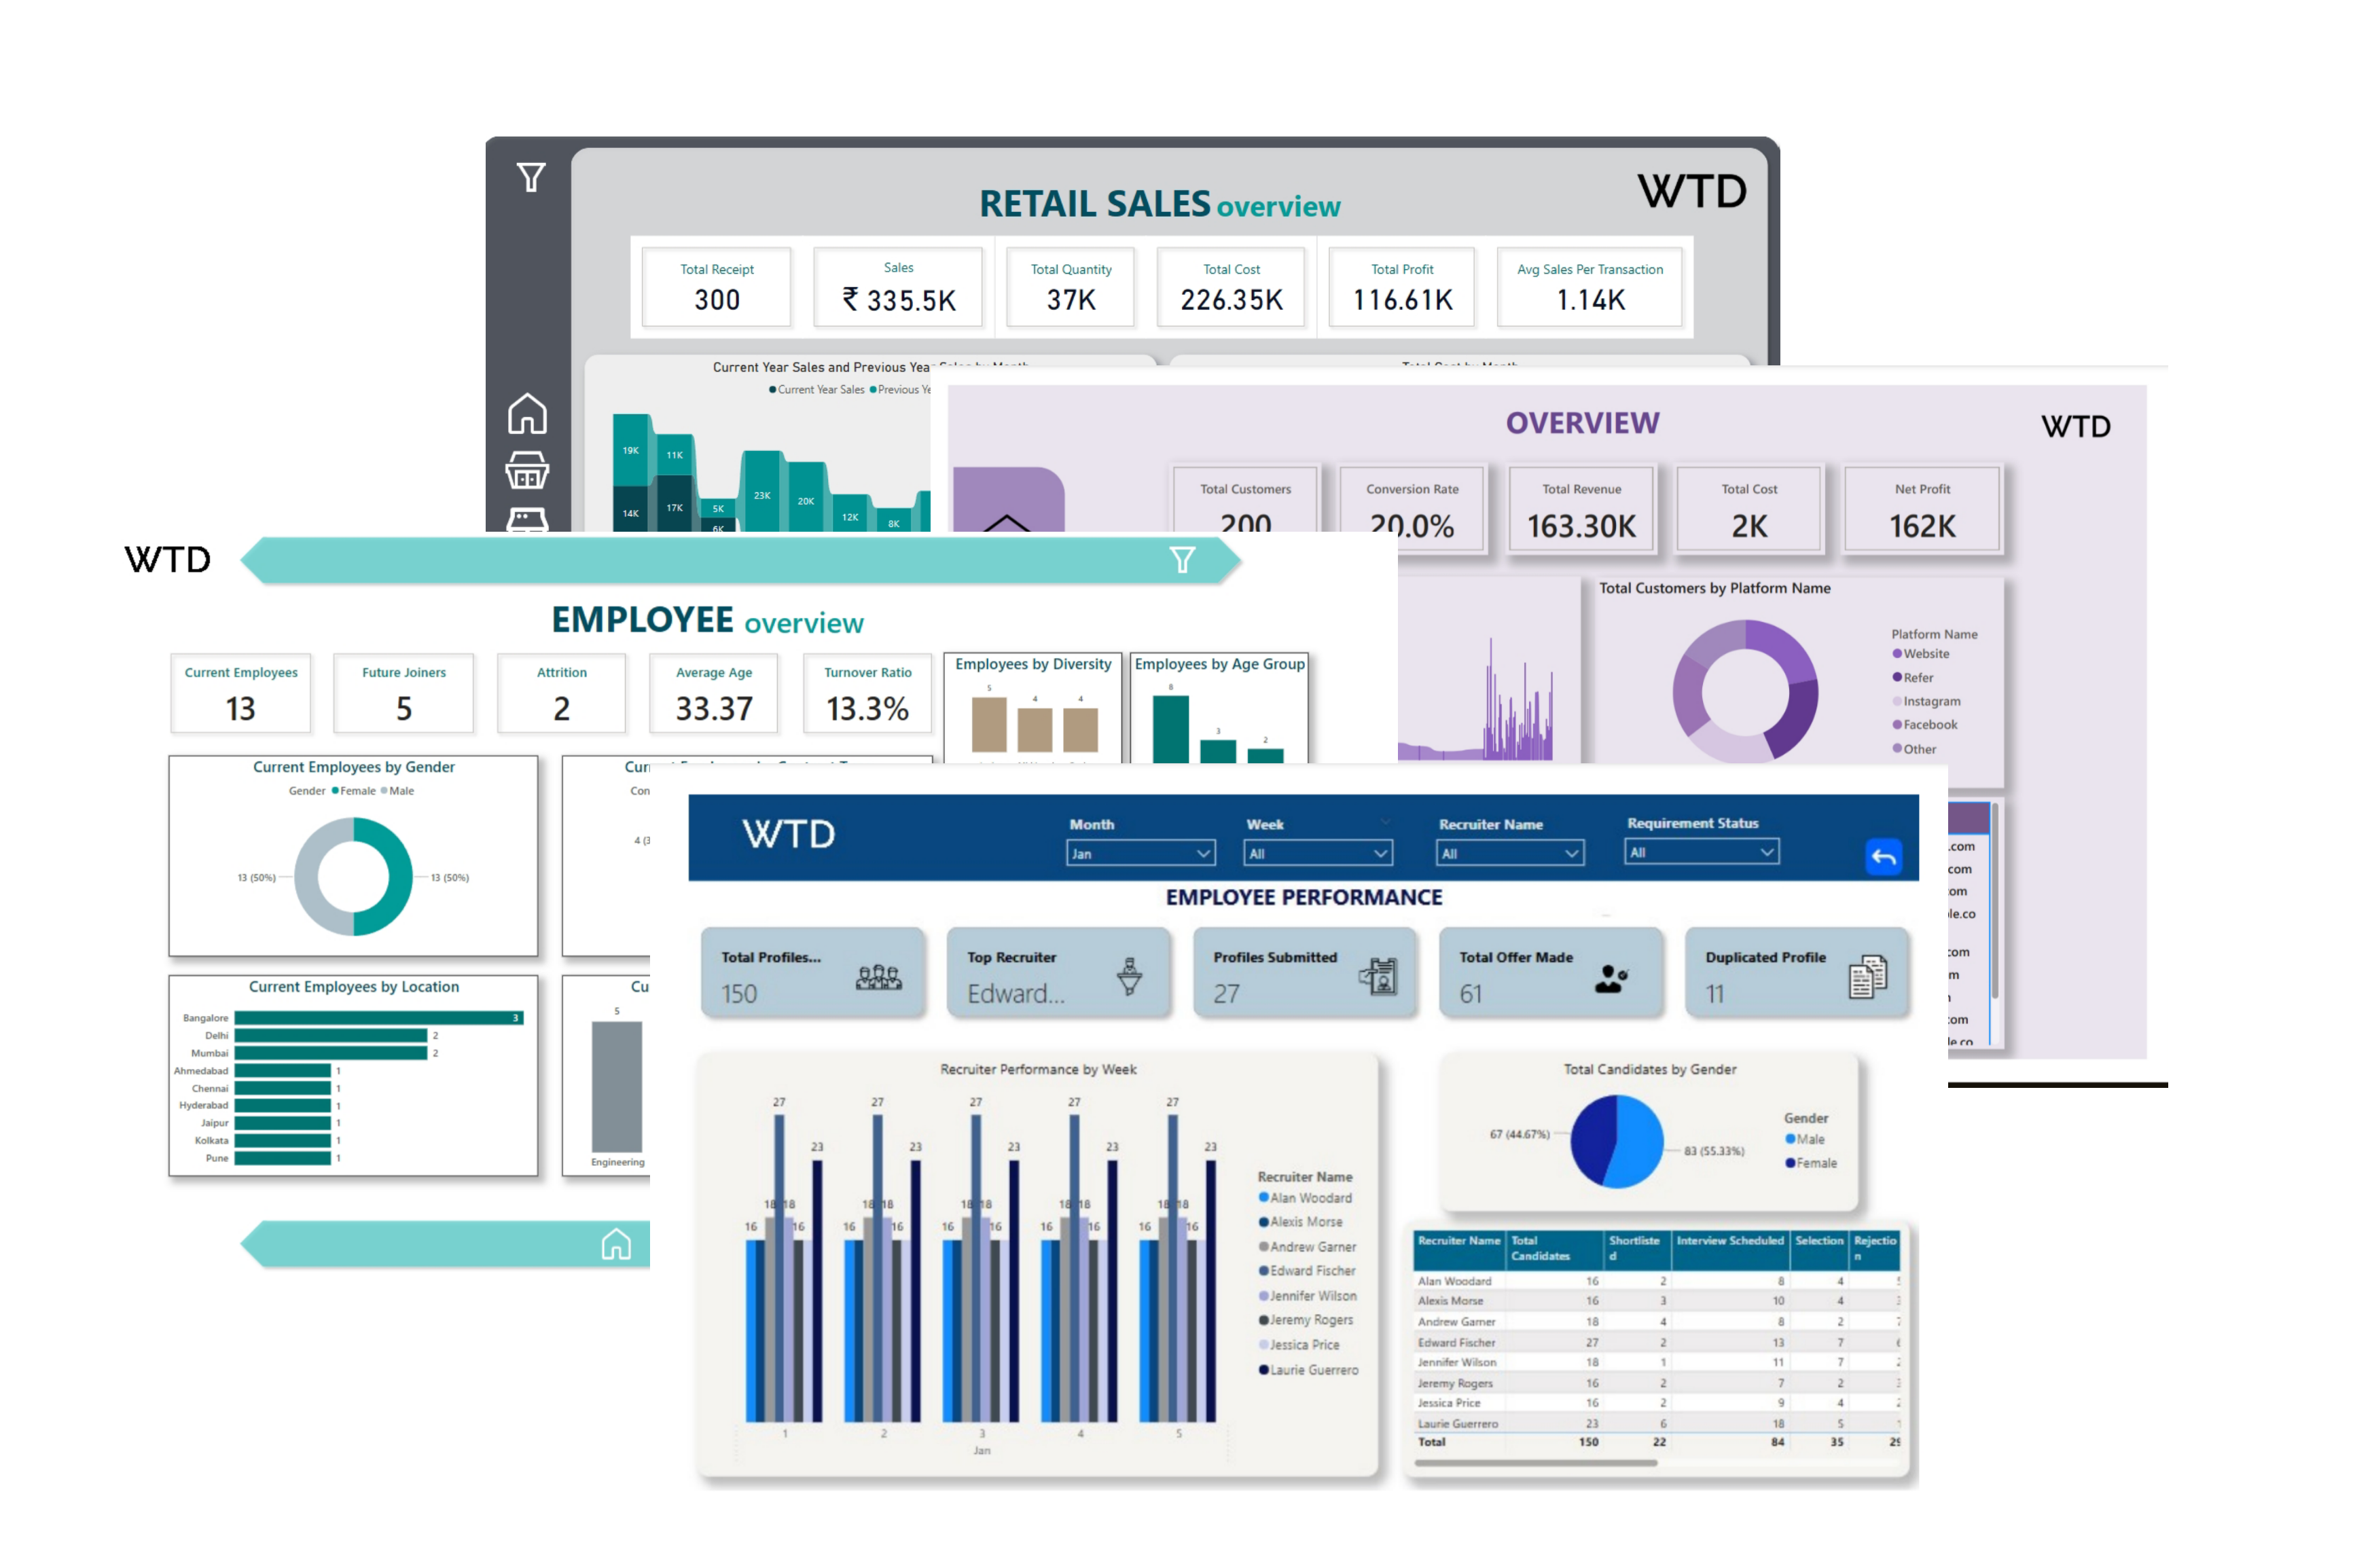
Whether it’s HR, Sales, Finance, or Inventory, our dashboards are fully modular. Add or remove sections based on your organizational goals, roles, or departmental needs.
Interactive Visualizations
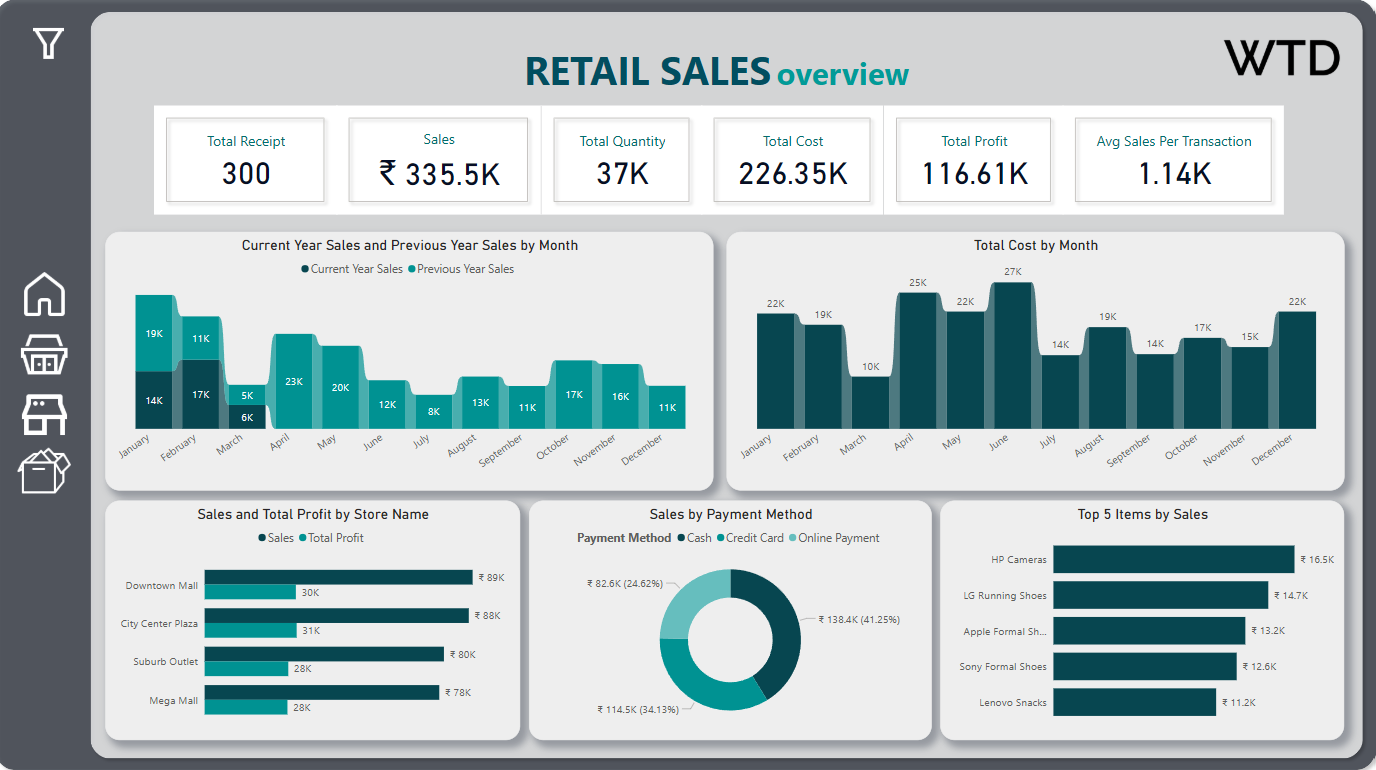
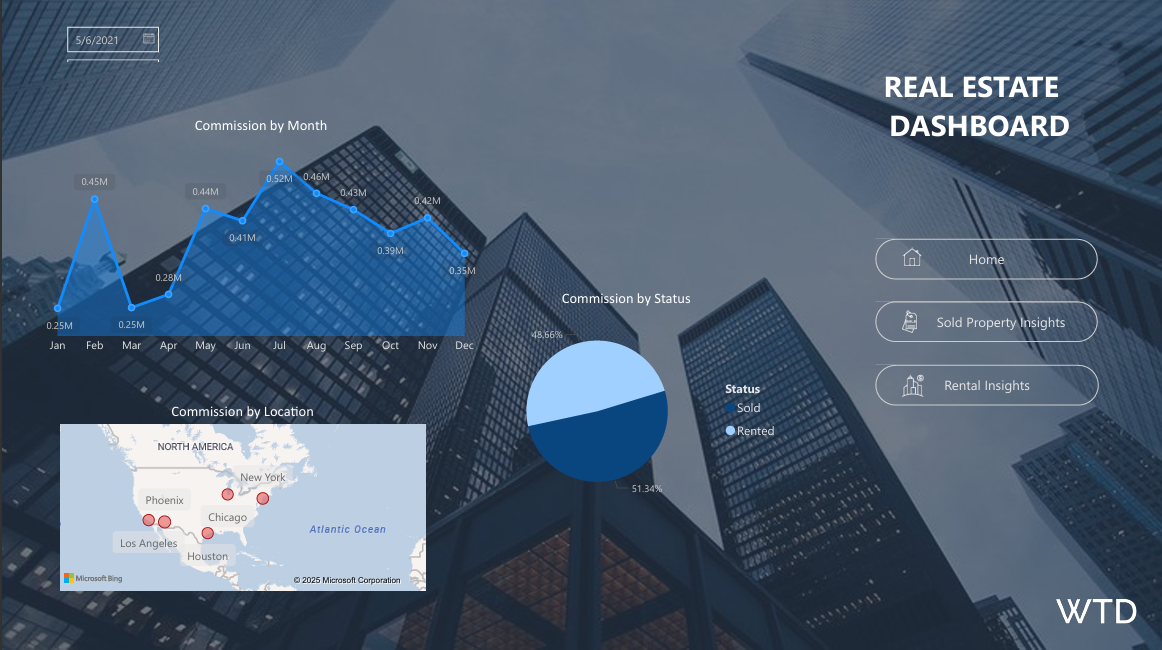
We integrate modern chart libraries like Recharts, Chart.js, and Power BI to visualize your data with clarity. Users can filter, drill down, and export insights with ease.
Secure Role-Based Access
Ensure that every team member only sees what they need. Role-based access control allows secure data segmentation and collaboration without compromising data integrity.
Our Achievements
5+
Happy Clients
15+
Projects Completed
200+
Hours of Support
Dashboard FAQs
A dashboard is a visual interface that displays key performance indicators (KPIs), metrics, and data insights in one place for quick decision-making.
Dashboards help track performance, identify trends, improve efficiency, and make informed decisions using real-time or scheduled data updates.
We use tools like Power BI, Tableau, Google Looker Studio, and custom-built dashboards using web technologies like React and JS libraries.
Yes, dashboards can integrate with Excel, SQL databases, CRMs, ERPs, APIs, and cloud sources like Google Analytics, Salesforce, and more.
Absolutely! All our dashboards are responsive and optimized for mobile, tablet, and desktop. We also support mobile apps like Power BI Mobile.
Yes, we follow best practices in data security, using encrypted data channels, access controls, and secure platforms like Microsoft and Google Cloud.
Yes, we create fully customizable dashboards — from colors and branding to charts and metrics — based on your business goals and preferences.
Simple dashboards can be completed within 3–5 days, while complex, multi-source dashboards may take up to 2–3 weeks based on requirements.
Yes! We offer training sessions, documentation, and ongoing support to ensure you or your team can use and update your dashboard with ease.