Retail Sales Dashboard
Optimize Your Retail Performance with Data-Driven Insights. Discover trends that boost sales and enhance customer experience.
Unlock the power of retail dashboards with comprehensive data visualization, including store performance, item sales, and customer behavior analysis.
Experience Live Interaction With Our HR Dashboard
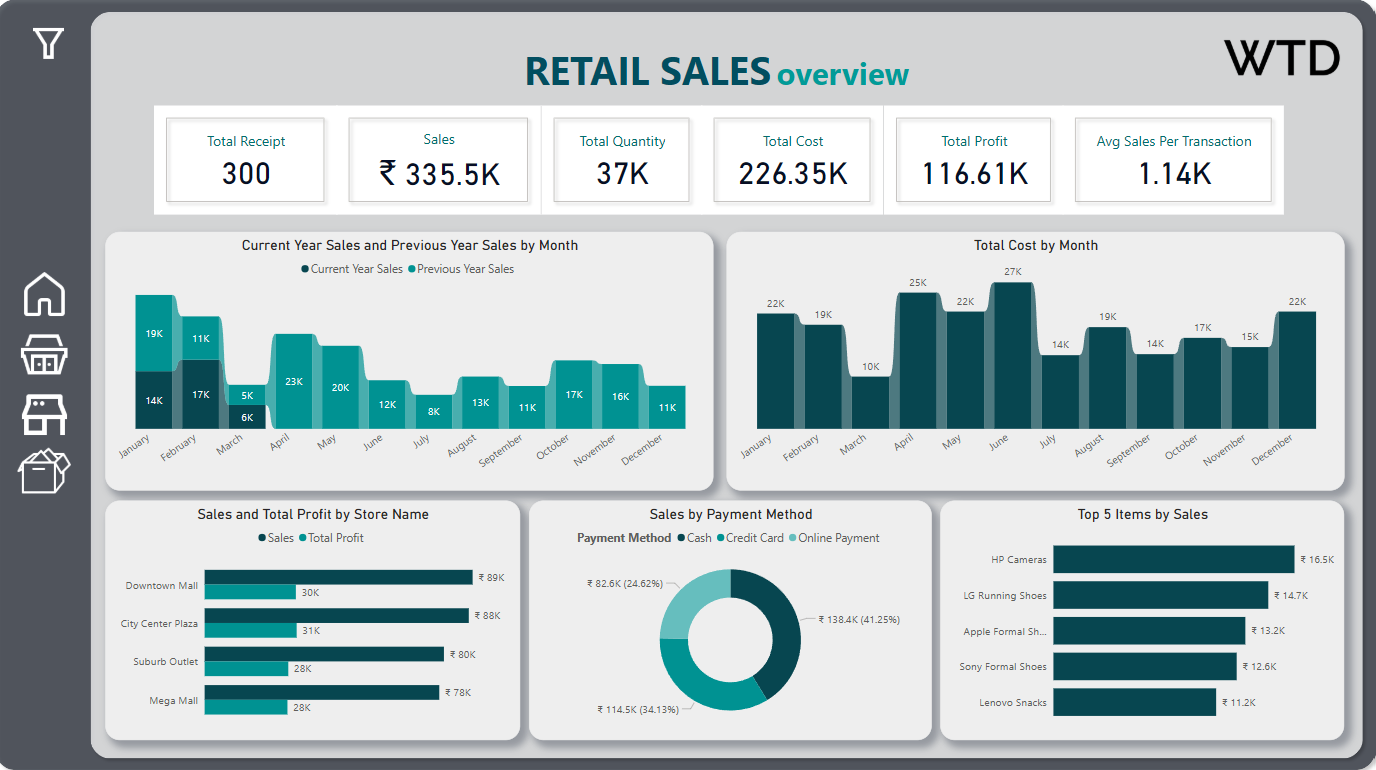
Retail Sales Overview
The Retail Sales Overview dashboard provides key insights into your store's performance, covering metrics such as total sales, receipts, quantity sold, costs, profits, and more.
It offers a detailed breakdown of monthly sales trends, cost distribution, store performance, payment methods, and top-selling items. The visualizations empower businesses to track sales patterns, optimize pricing strategies, and make data-driven decisions.
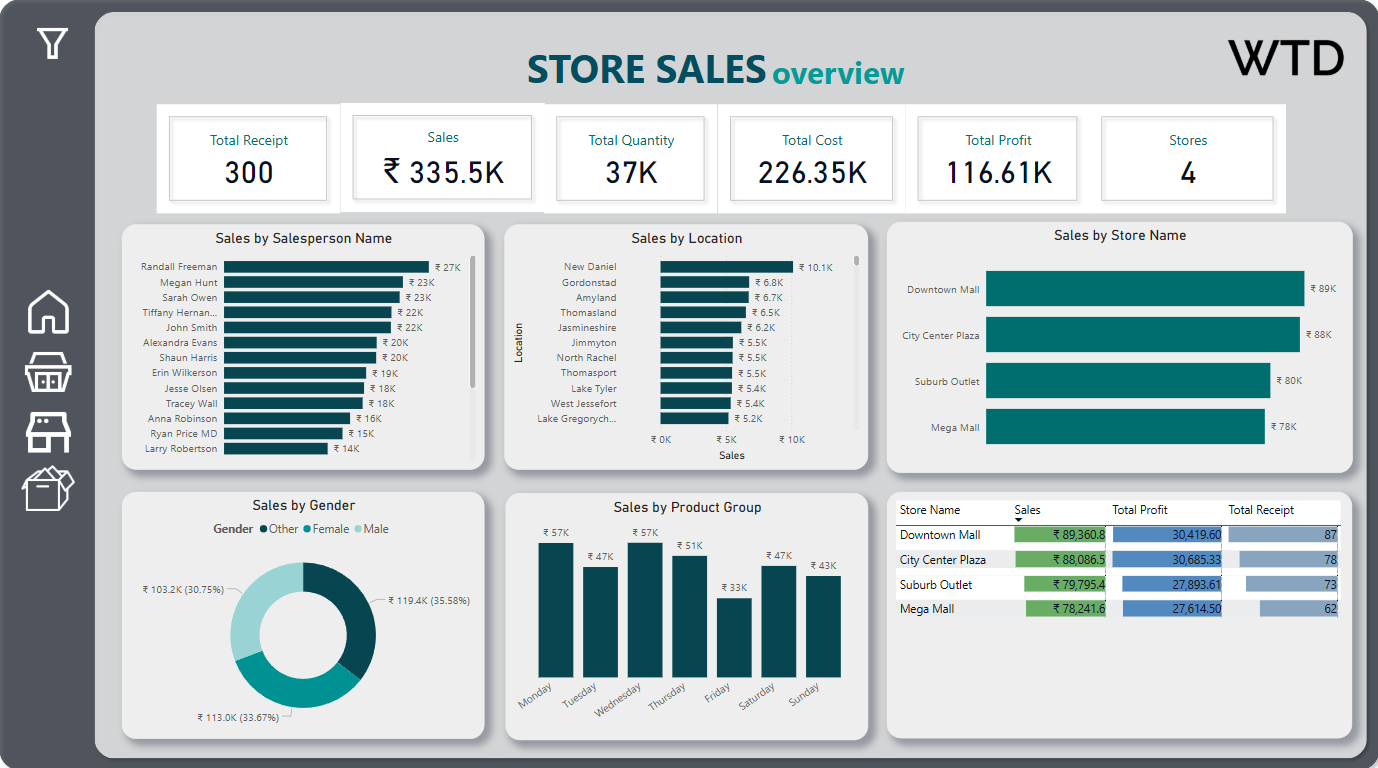
Store Sales Overview
The Store Sales Overview dashboard offers insights into the performance of individual stores, covering metrics such as total receipts, sales, quantity sold, costs, profits, and the number of stores.
It provides detailed visualizations on sales by salesperson, location, store name, and product group. Additionally, the dashboard highlights sales trends by gender and daily sales distribution, empowering businesses to evaluate store performance and optimize sales strategies.
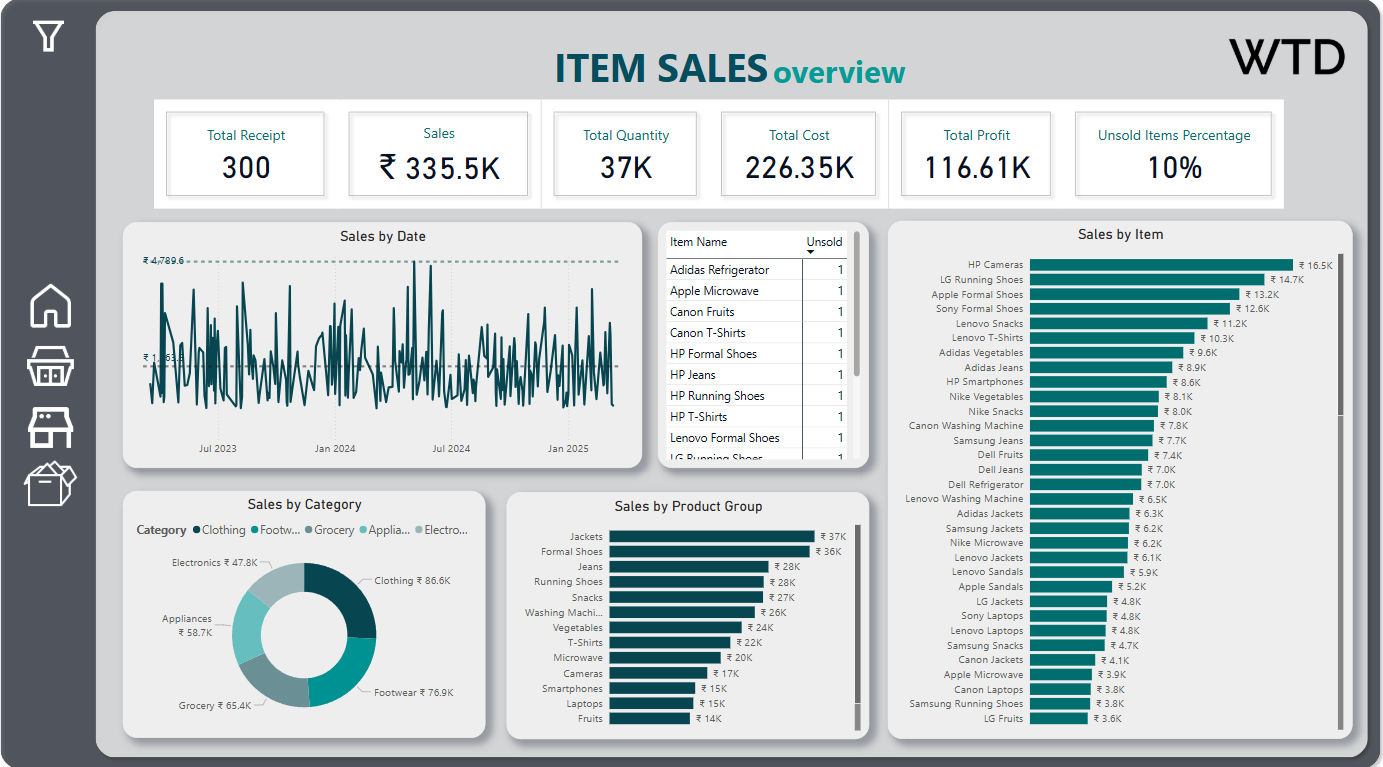
Item Sales Overview
The Item Sales Overview dashboard provides insights into item-level sales performance, profitability, and inventory management. It covers metrics such as total receipts, sales, quantity sold, total cost, total profit, and the percentage of unsold items.
The dashboard visualizes sales trends by date, item, category, and product group, enabling businesses to identify top-performing products and address slow-moving inventory. This helps in making data-driven decisions for optimizing product offerings and improving sales efficiency.
Get expert help to build your dashboard
At What The Data, we help businesses gain insights with Power BI, Tableau, Excel, and Google Looker across industries like HR, retail, travel, marketing, and more .
Boost Your Dashboard!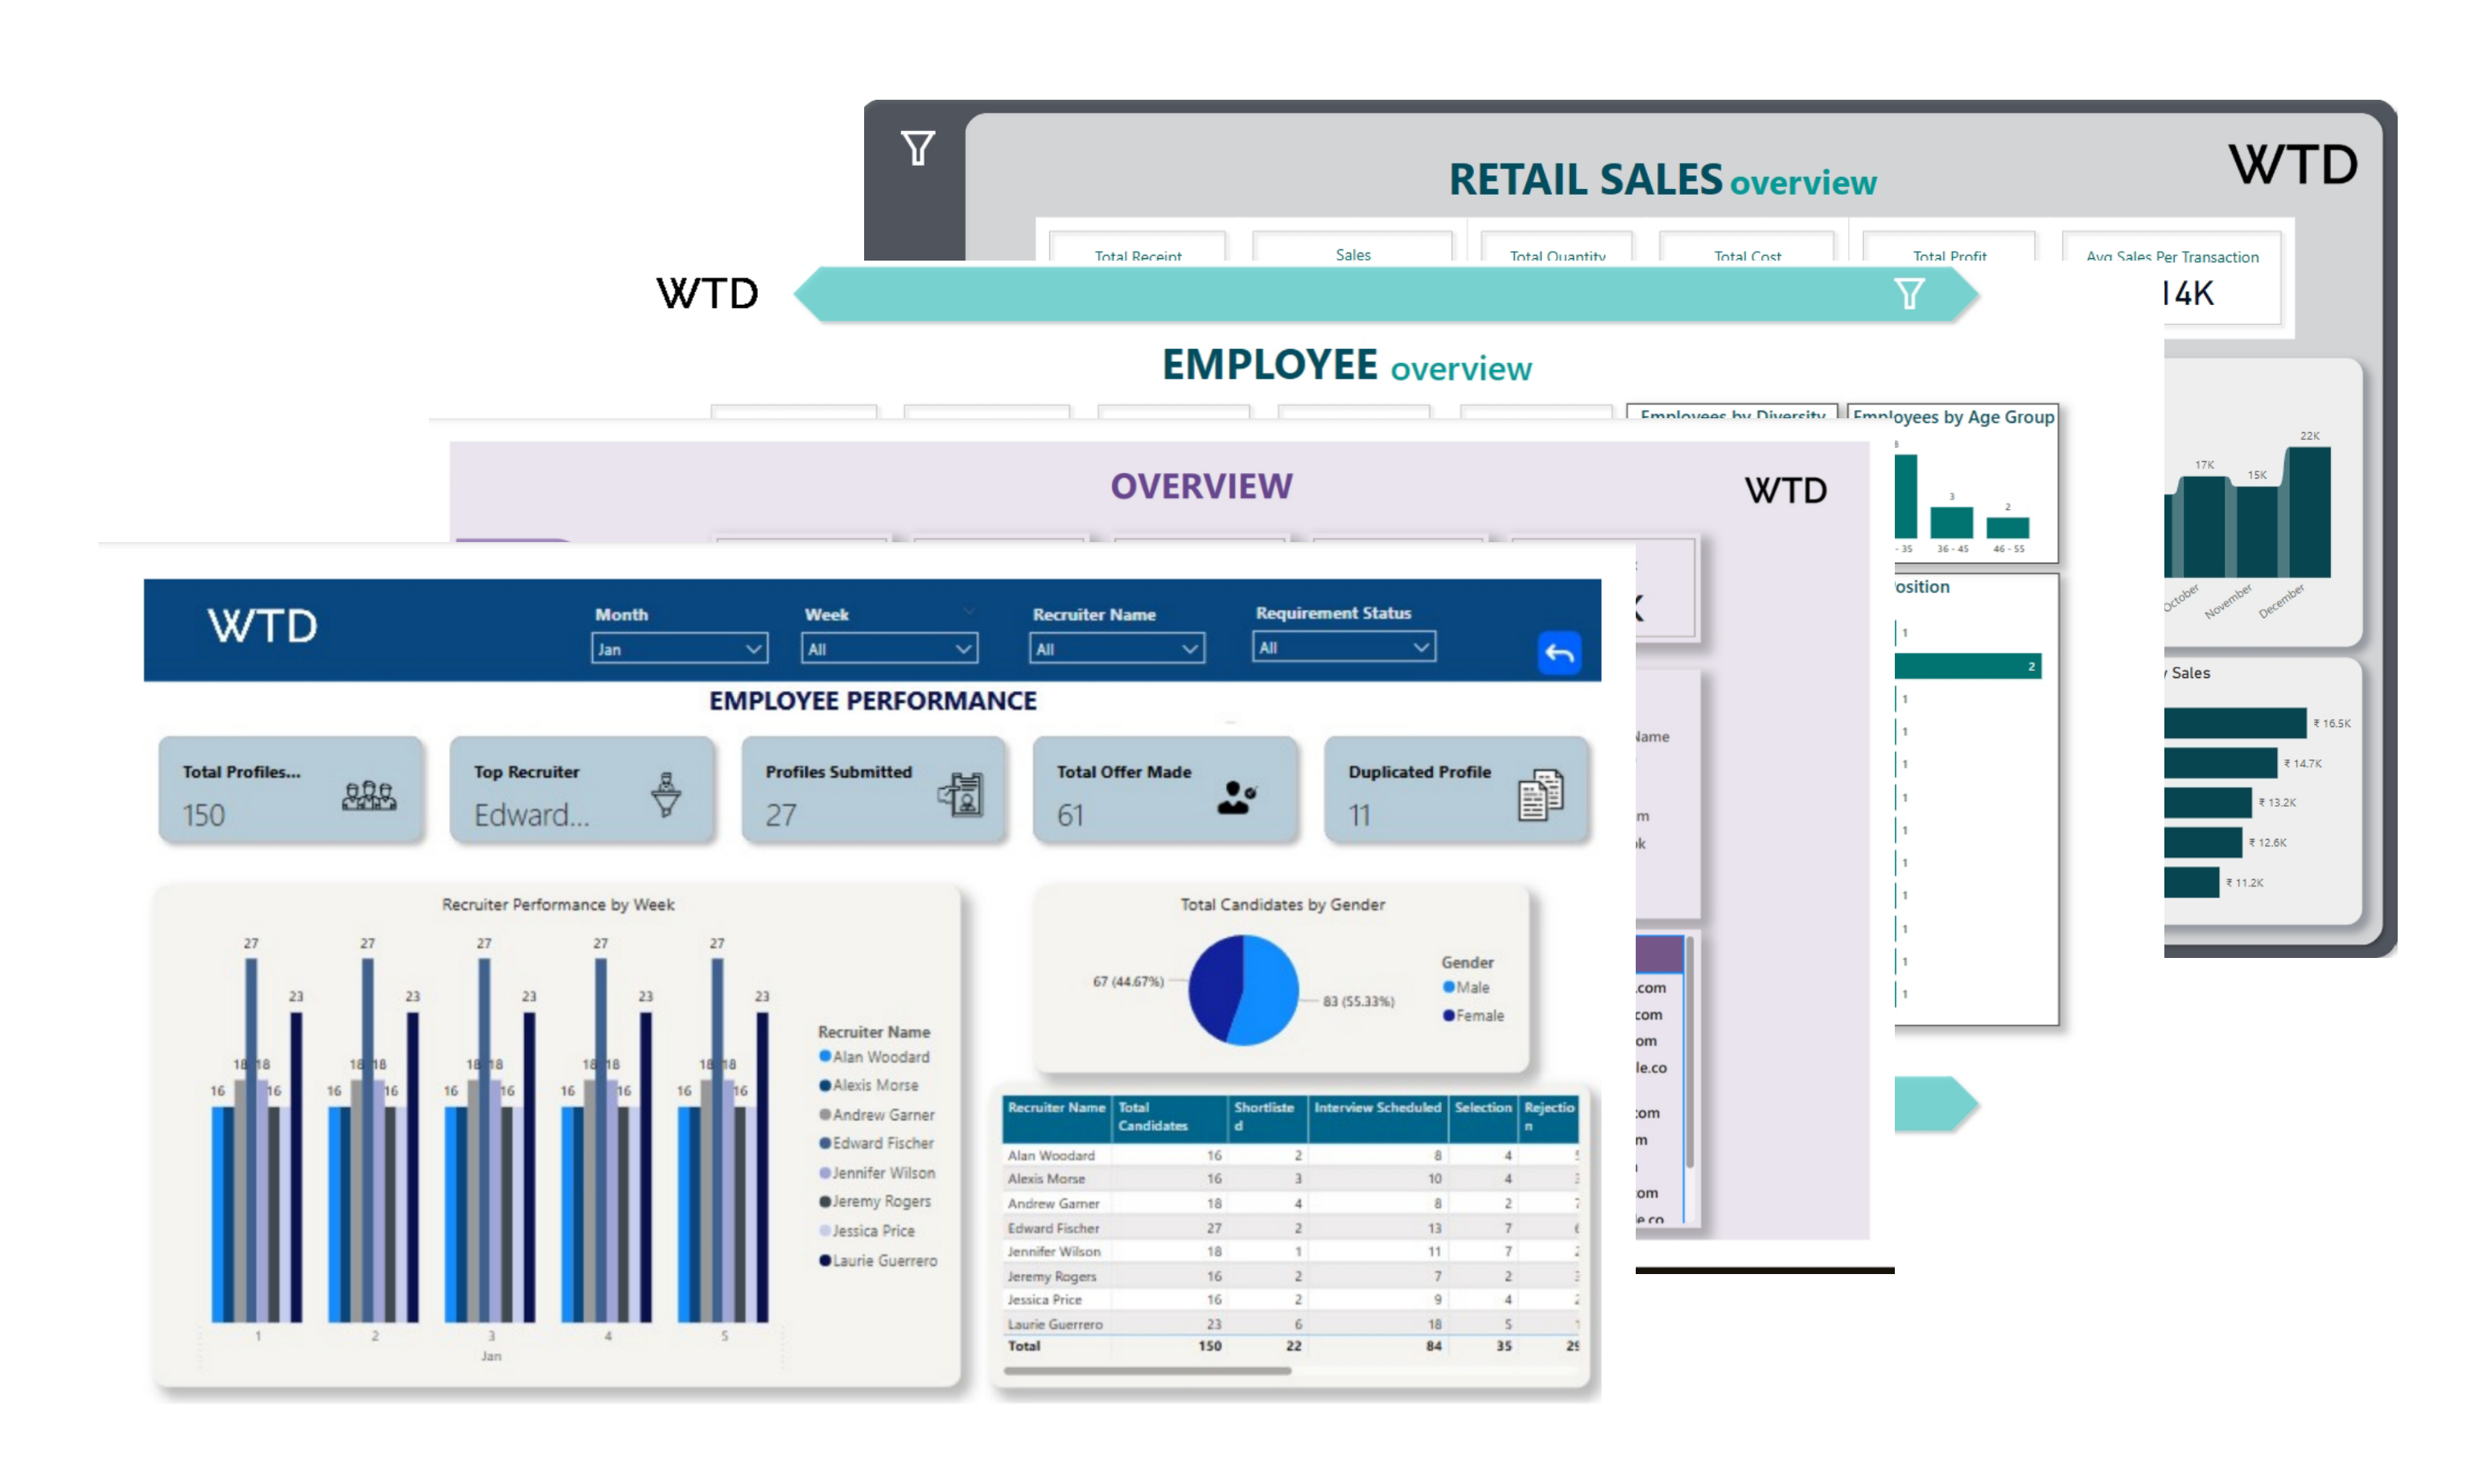
Retail Dashboard FAQs
A Retail Sales Dashboard is a visual tool that provides insights into sales performance, revenue trends, and inventory management. It helps retailers make data-driven decisions, optimize stock levels, and identify sales opportunities.
The cost depends on the complexity, customization, and data integration. Our consultancy offers tailored pricing based on your business requirements. Contact us for a detailed quote.
Yes, the dashboard is fully customizable. You can modify the color scheme, fonts, and layout to align with your company’s branding.
The implementation timeline varies based on the data complexity and integration needs. On average, it takes 2 to 4 weeks to deploy a fully functional Retail Sales Dashboard.
The dashboard provides insights into total sales, item performance, profitability, stock trends, and customer buying patterns. It enables businesses to identify best-selling products and manage inventory efficiently.
The main stages include data collection, cleaning, dashboard design, integration with existing systems, testing, and deployment. Ongoing maintenance ensures data accuracy and reliability.