Real Estate Dashboard
Empower Your Real Estate Business with Data-Driven Insights. Discover market trends, property performance, and client engagement metrics.
Unlock the full potential of your real estate operations with dynamic dashboards showcasing sales performance, agent productivity, and property analytics.
Experience Live Interaction With Our Real Estate Dashboard
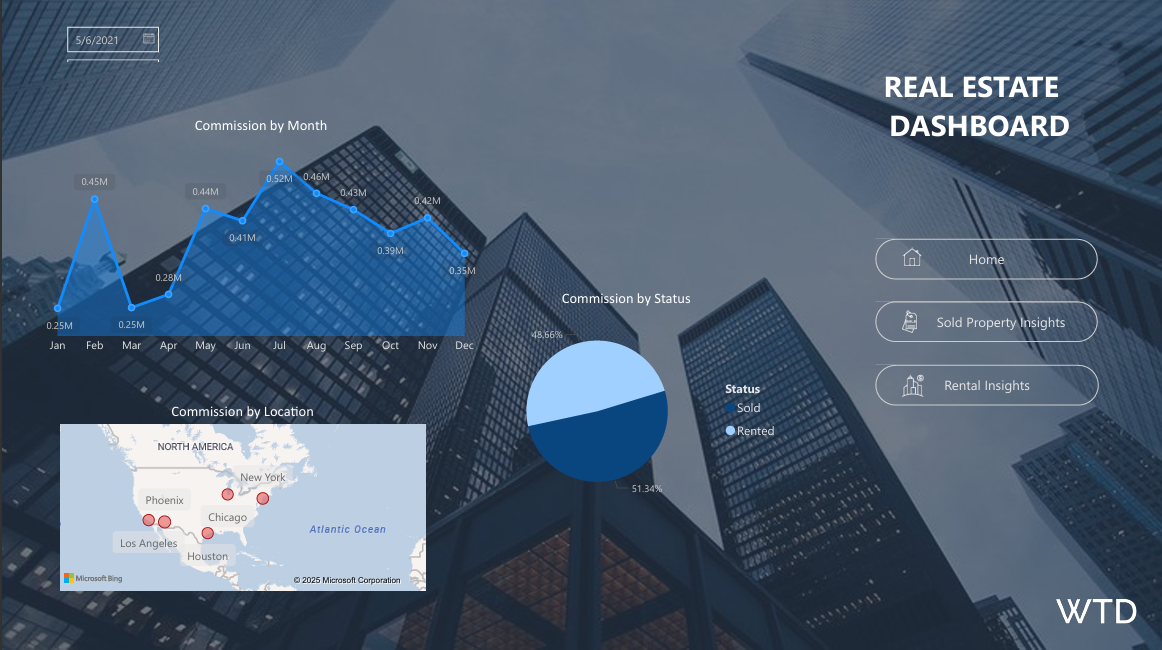
Real Estate Dashboard Overview
The Real Estate Dashboard offers comprehensive insights into property transactions, including metrics such as monthly commissions, rental vs. sold ratios, and geographic performance.
It features detailed visualizations like commission trends by month, property status distribution, and location-based insights, enabling real estate professionals to identify trends, target high-performing areas, and make data-driven decisions.

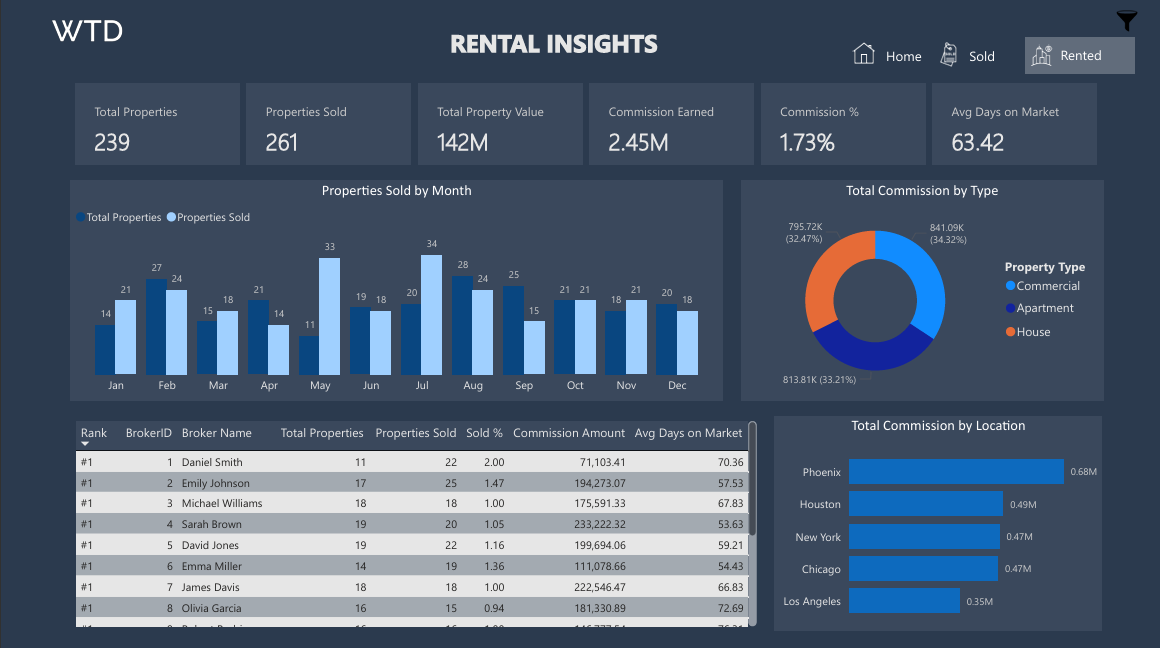
Rental Insights Dashboard
The Rental Insights dashboard provides a comprehensive view of property rental performance, displaying key metrics like total properties, properties sold, property value, commission earned, and average days on market.
Visual breakdowns include monthly sales trends, commission by property type, location-wise performance, and broker-wise rankings. This dashboard enables real estate professionals to monitor market activity, identify top-performing brokers and regions, and make data-driven decisions to improve rental operations.
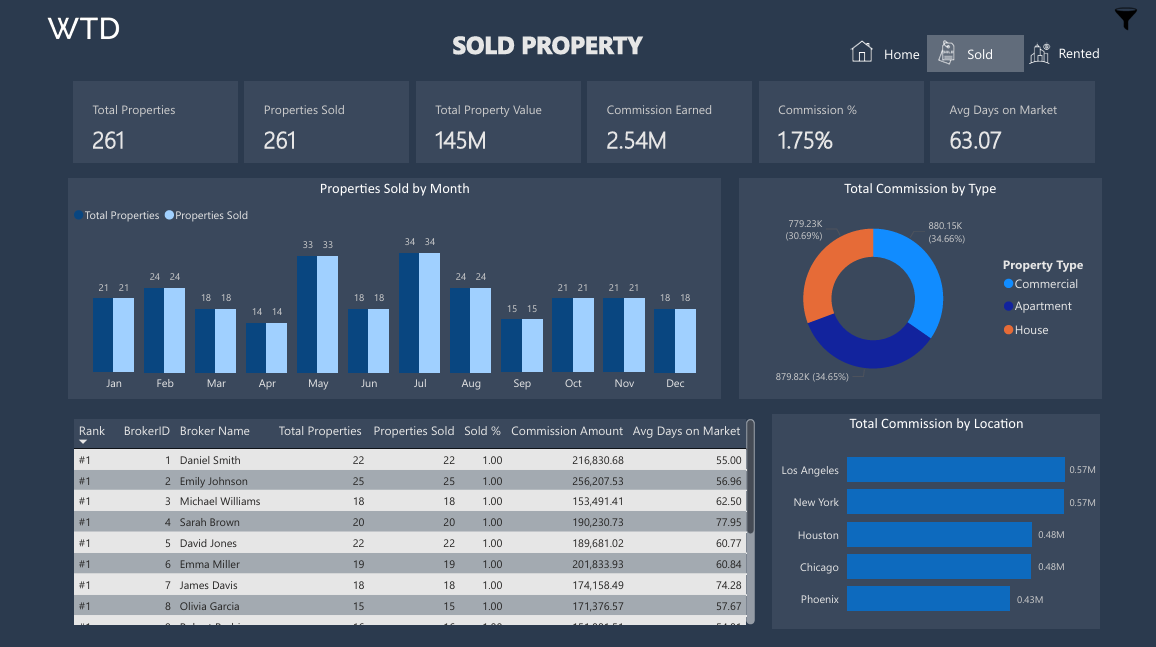
Sold Property Dashboard
The Sold Property dashboard offers a detailed overview of real estate sales performance, covering essential KPIs such as total properties, properties sold, total property value, commission earned, commission percentage, and average days on market.
Key visualizations include monthly sales trends, commission breakdown by property type and location, and a broker-wise performance table. This dashboard helps real estate firms track top brokers, optimize sales strategies, and gain insights into high-performing regions and property types.
Get expert help to build your dashboard
At What The Data, we help businesses gain insights with Power BI, Tableau, Excel, and Google Looker across industries like HR, retail, travel, marketing, and more .
Boost Your Dashboard!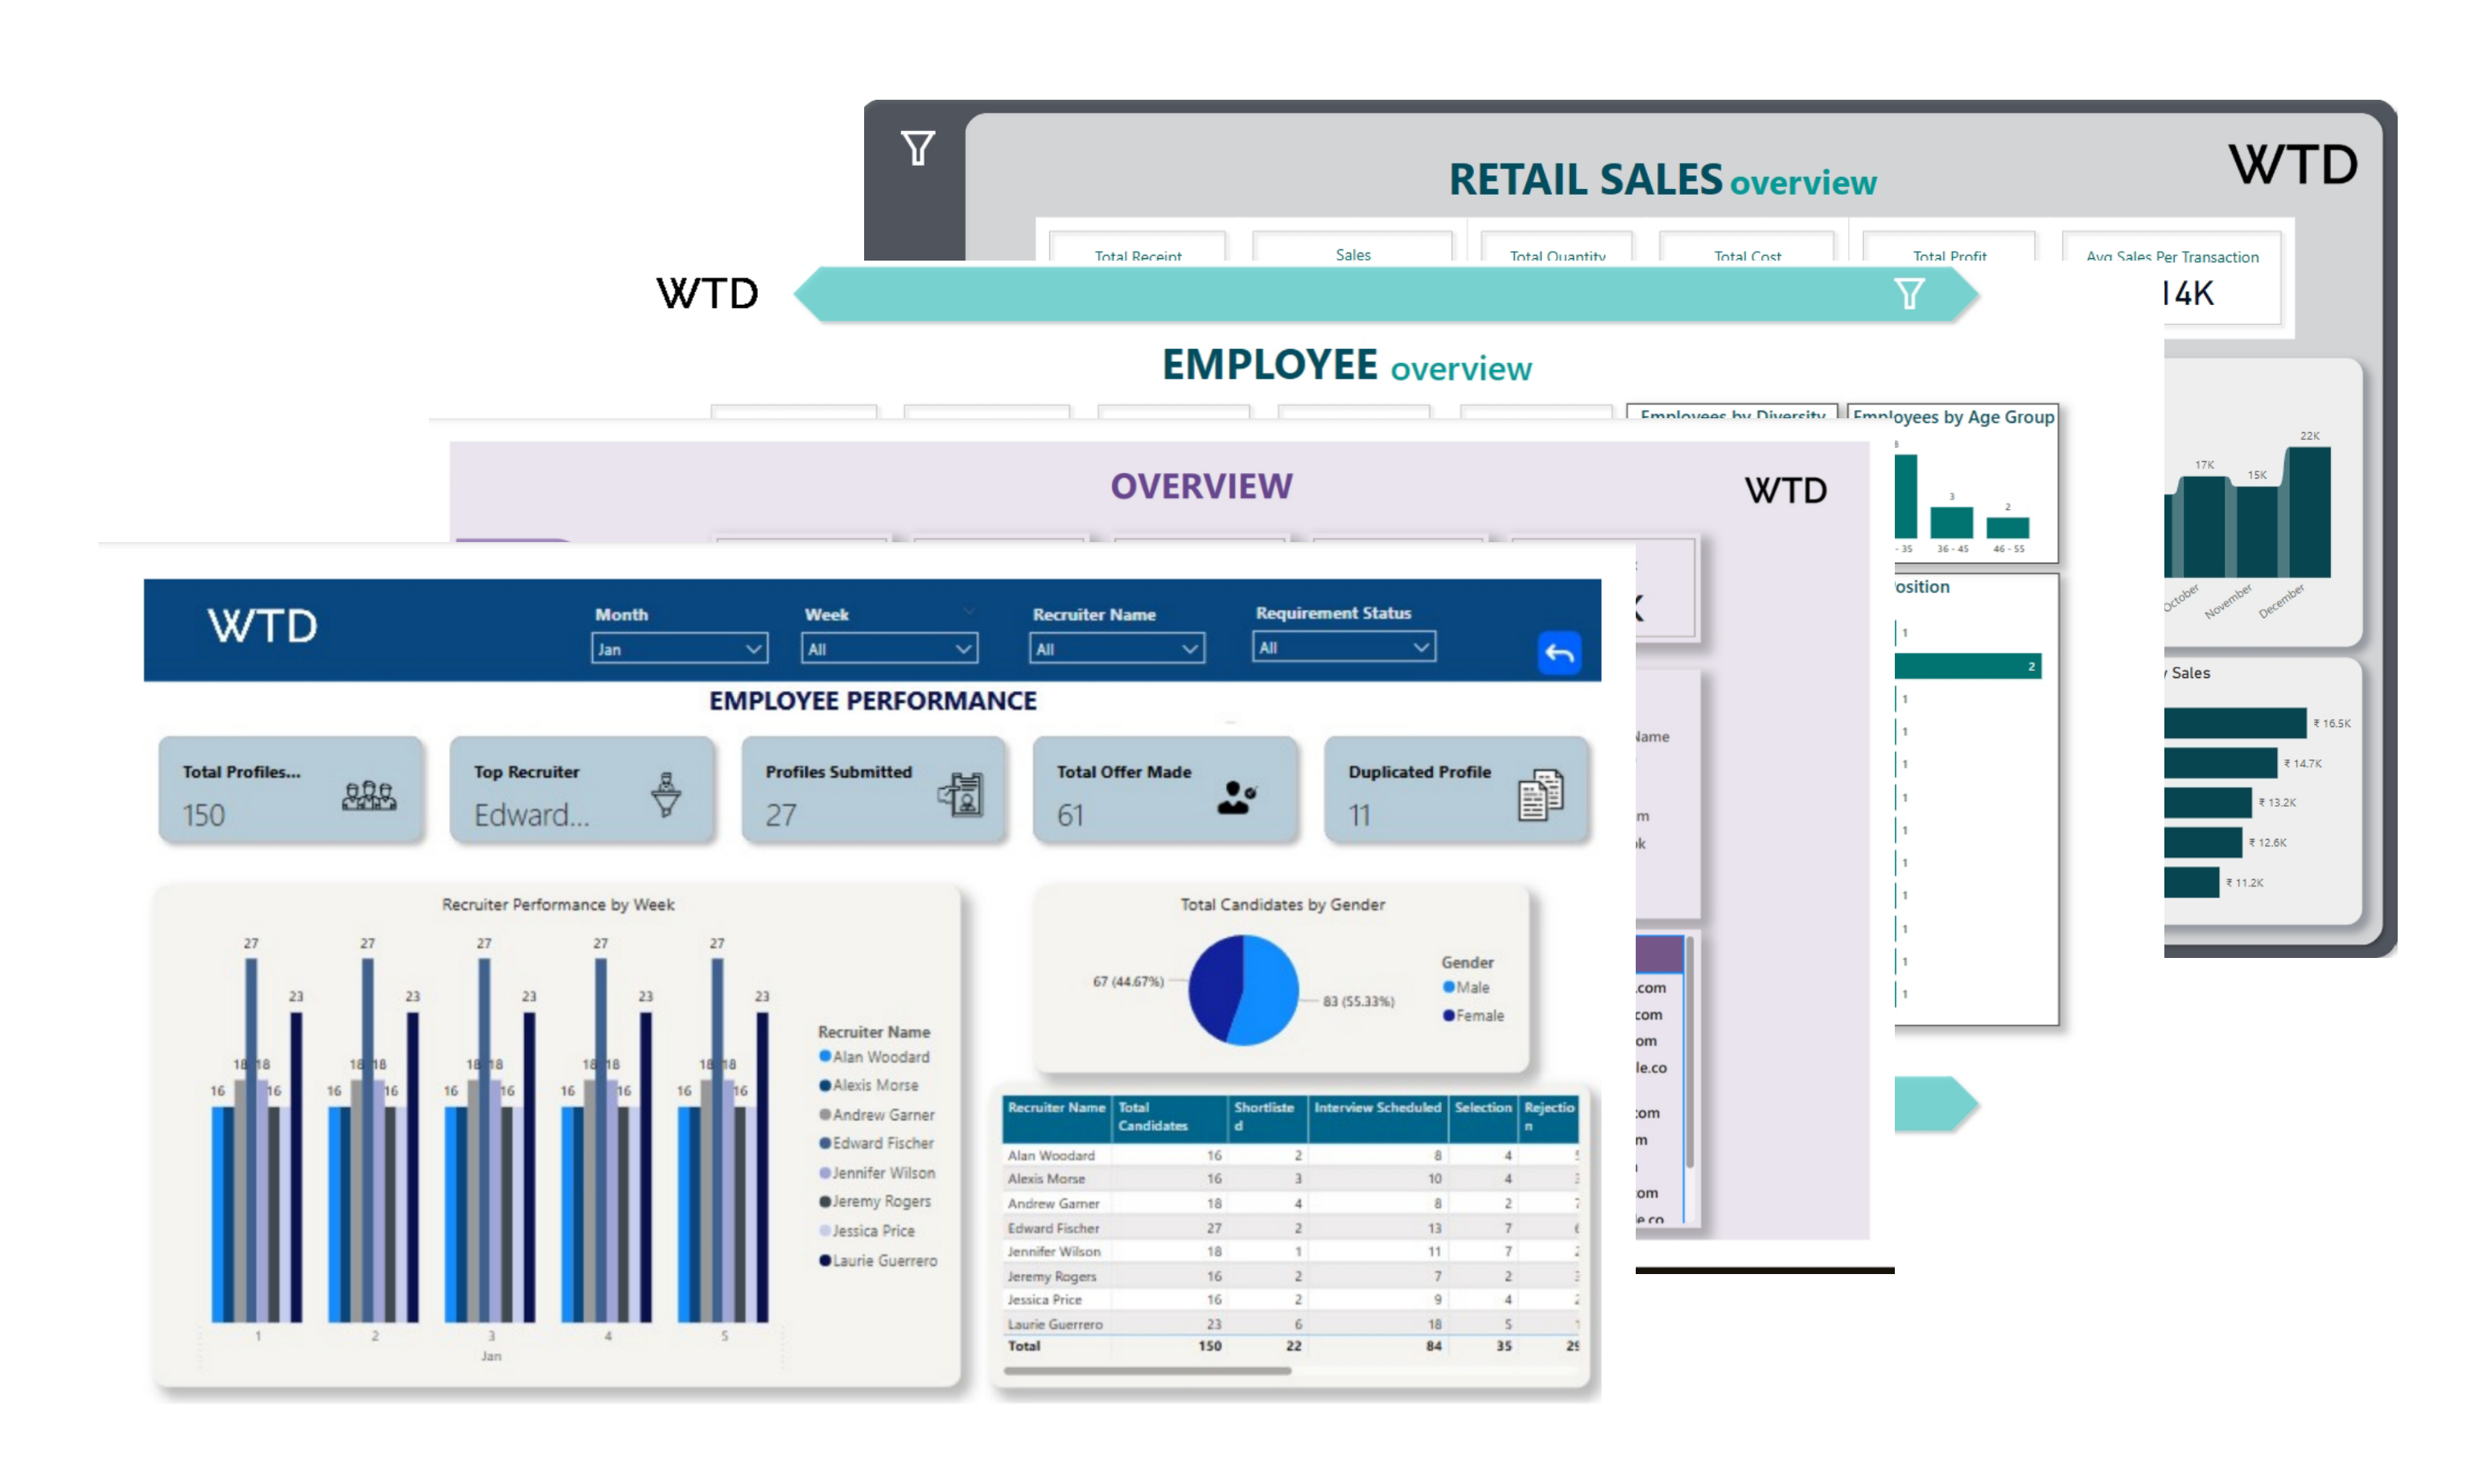
Real Estate Dashboard FAQs
A Real Estate Dashboard is a visual analytics tool that provides insights into property sales, commission performance, broker efficiency, and market trends. It helps agencies make informed decisions and track key performance indicators in real time.
The pricing varies based on the complexity of data, number of users, and customization required. Contact us with your business needs to receive a tailored quote.
Yes, the dashboard is fully customizable. You can configure property types, location filters, commission structures, and branding elements to match your agency's workflow and goals.
Implementation typically takes 2 to 3 weeks depending on data sources, integration requirements, and reporting complexity. We also offer expedited deployment options.
You can monitor total properties listed and sold, average days on market, broker-wise performance, property value trends, and commission breakdowns by location and type.
The process involves requirement gathering, data integration, dashboard design, testing, deployment, and ongoing support to ensure reliable performance and up-to-date insights.