Sales Analysis
Empower Your Sales Strategy with Data-Driven Insights. Gain a deeper understanding of revenue trends, customer behavior, and product performance.
Unlock the power of sales dashboards with comprehensive data visualization, including Sales Overview, Customer Sales, Item Sales, and Sales Order.
Experience Live Interaction With Our Sales Dashboard
Sales overview
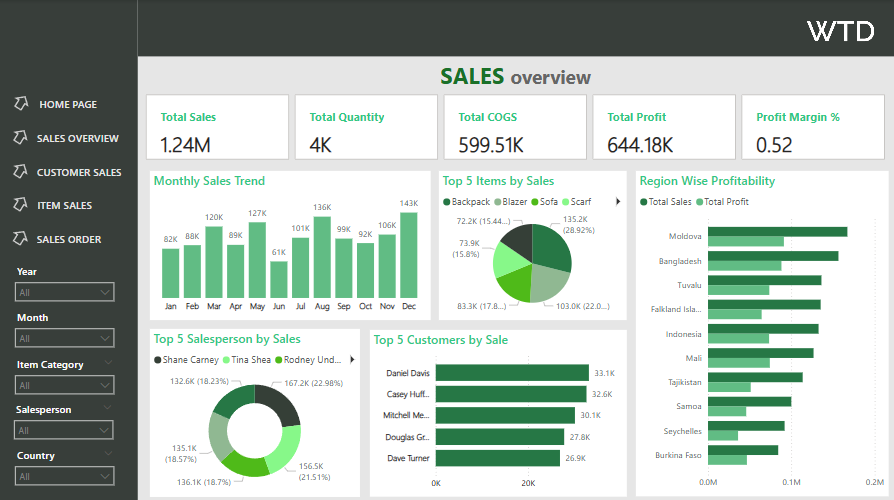
The Sales overview dashboard provides insights into your business performance, covering key metrics such as total sales, total quantity, total profit, profit margin, and more.
It offers a detailed breakdown of sales by region, salesperson, customer, item category, and monthly trends. The visualizations help sales teams track performance, identify key trends, and make data-driven decisions to optimize revenue and growth strategies.
Customer sales
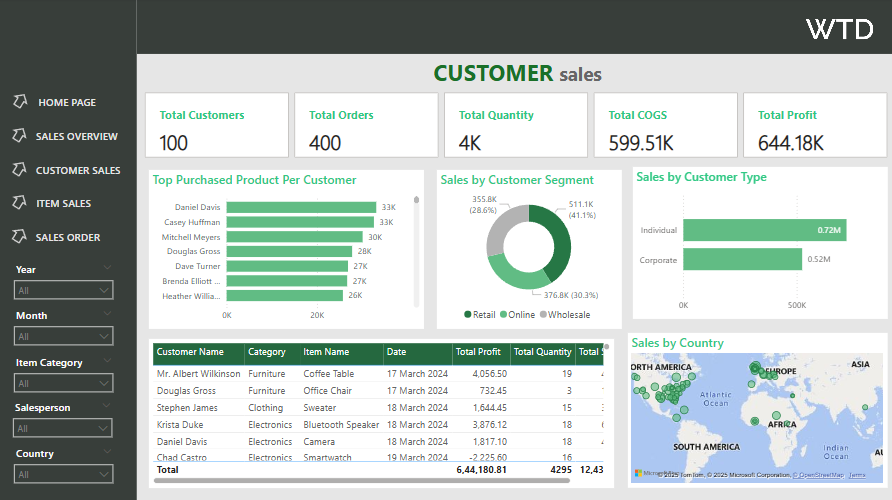
The Customer sales dashboard provides a comprehensive view of customer purchasing behavior, covering key metrics such as total customers, total orders, total quantity, total cost of goods sold (COGS), and total profit.
It includes insights into top-purchased products per customer, sales by customer segment, sales by customer type, and geographic distribution. The detailed table highlights customer details, including purchase date, category, item name, total profit, and total quantity. This enables sales teams to track customer trends, identify key buyers, and optimize sales strategies.
Item sales
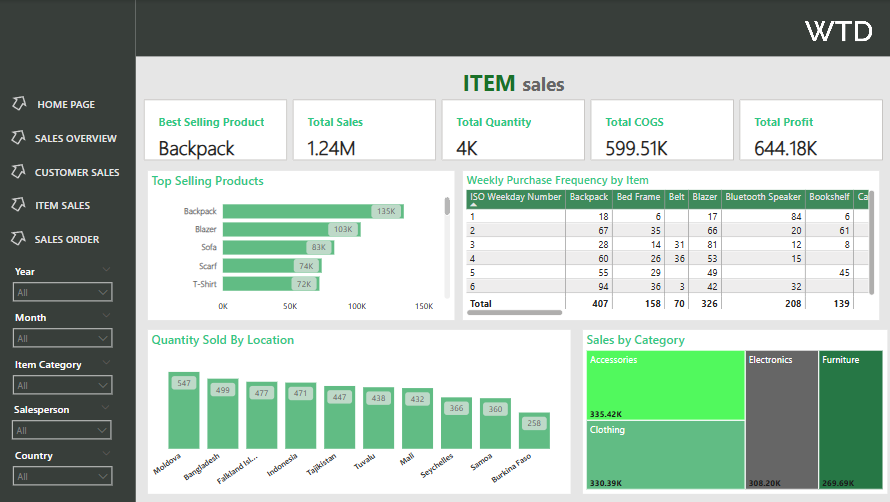
The Item sales dashboard provides key insights into product performance, covering essential metrics such as best-selling products, total sales, total quantity sold, total cost of goods sold (COGS), and total profit.
It includes a breakdown of weekly purchase frequency by item, quantity sold by location, and sales distribution by category. The visualizations help sales teams identify top-performing products, analyze regional demand, and optimize inventory management.
Sales order
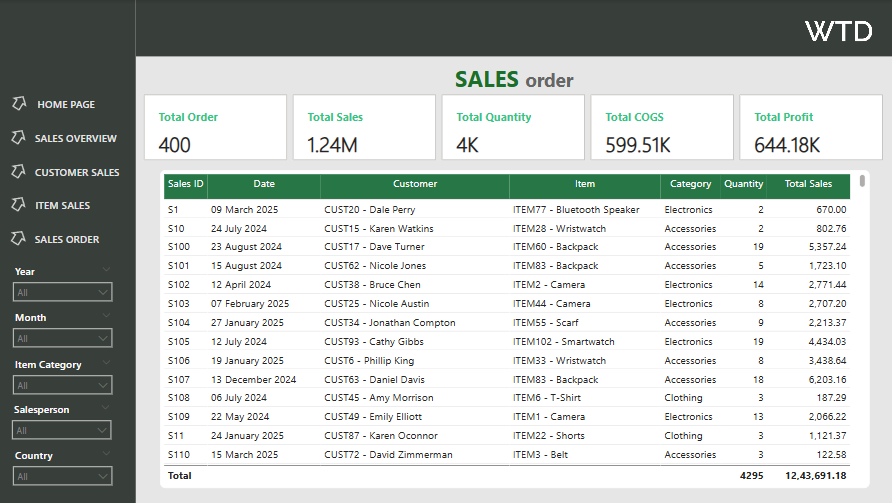
The Sales order dashboard provides a comprehensive overview of total orders, sales, quantity sold, and cost of goods sold (COGS). It helps organizations monitor customer purchases, item categories, and revenue trends.
Key metrics include:
- Total Orders: Displays the total number of orders placed.
- Total Sales: Represents the overall revenue generated from sales.
- Total Quantity: Highlights the total number of items sold.
- COGS & Profit: Tracks the cost of goods sold and total profit margin.
- Order Breakdown: Categorizes sales by customer, item, and category.
Get expert help to build your dashboard
At What The Data, we help businesses gain insights with Power BI, Tableau, Excel, and Google Looker across industries like HR, retail, travel, marketing, and more .
Boost Your Dashboard!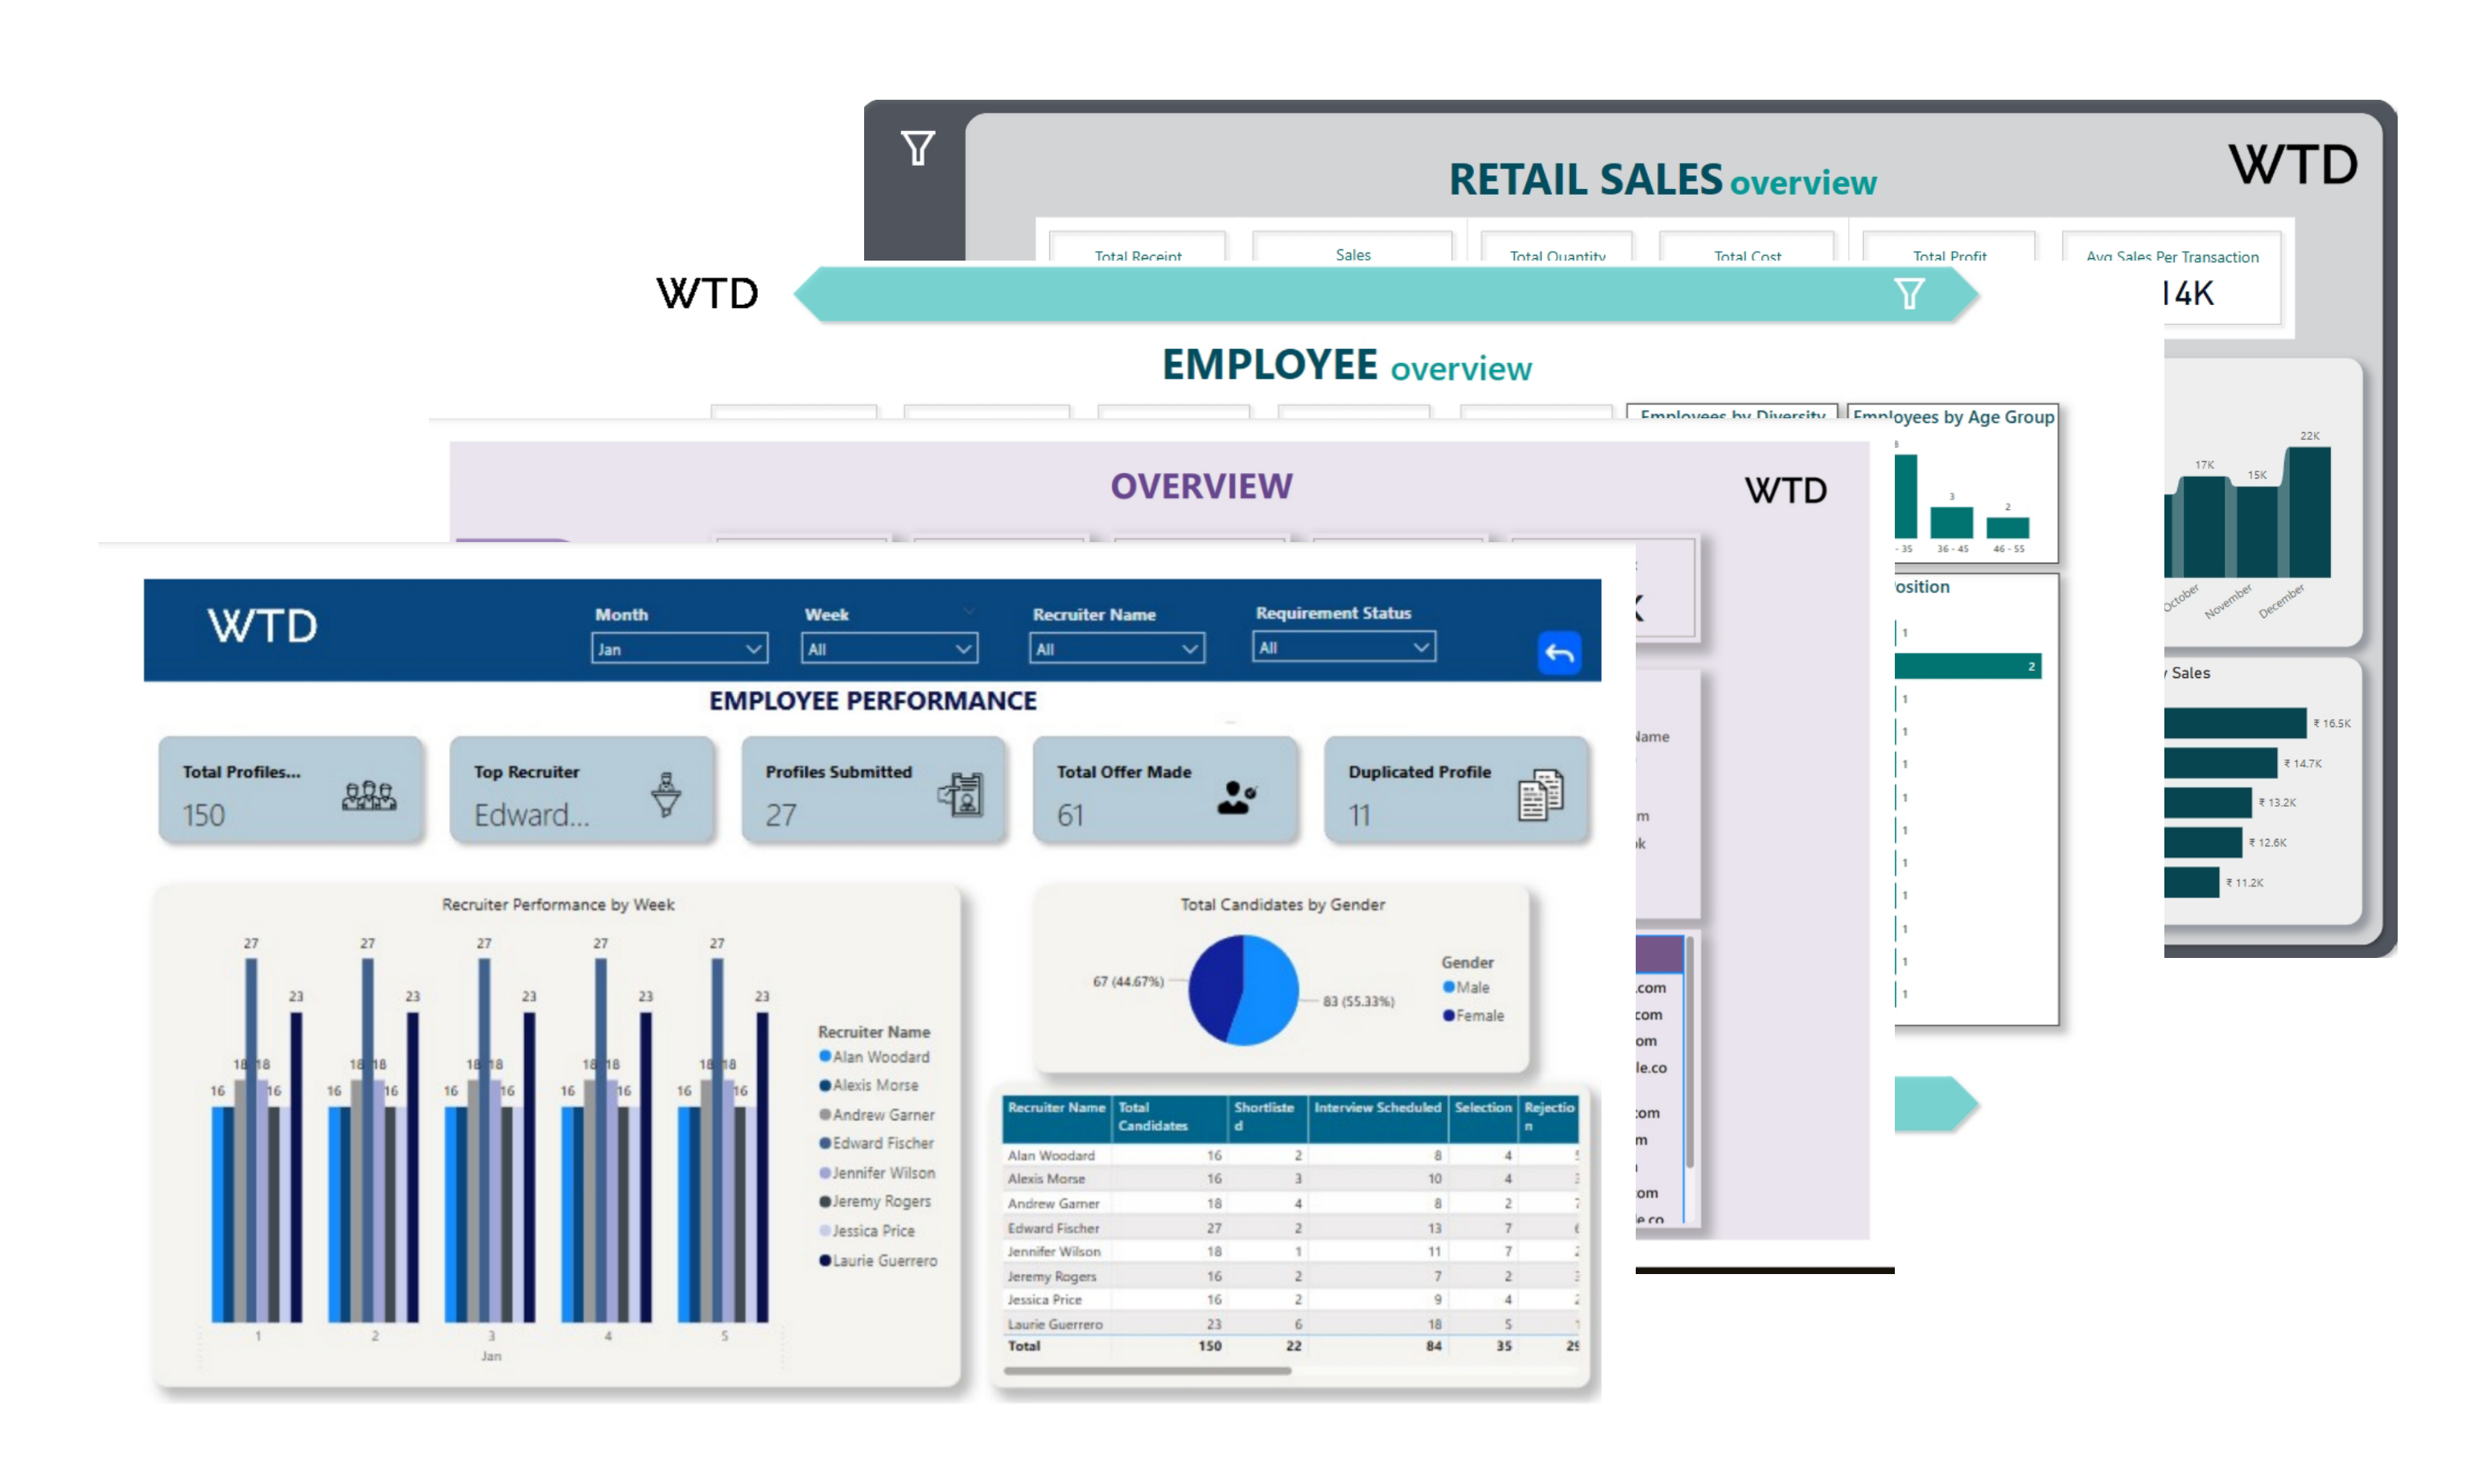
Sales Dashboard FAQs
A Sales Dashboard is a visual representation of key sales metrics, providing insights into revenue, customer behavior, and sales performance. It helps businesses track sales trends and make data-driven decisions.
The cost depends on the level of customization and data complexity. Our consultancy offers tailored solutions based on your business needs. Contact us for a detailed quote.
Yes, the dashboard is fully customizable. You can modify the layout, colors, and data visualizations to match your brand identity and preferences.
The implementation timeline depends on data volume and system complexity. On average, it takes 2 to 4 weeks to deploy a fully functional sales dashboard.
Sales Analytics involves analyzing sales data to optimize business strategies. Sales Dashboards display key analytics using real-time charts, KPIs, and reports for better decision-making.
The main stages include data collection, data cleaning, dashboard design, integration with CRM or sales tools, testing, and deployment. Regular updates ensure accurate insights.