Travel Agency
Unlock Actionable Insights for Your Travel Agency with Tailored Analytics Solutions.
Discover trends in customer journeys, bookings, revenue, and tour package performance with our comprehensive Power BI dashboard.
Experience Live Interaction With Our Travel Dashboard
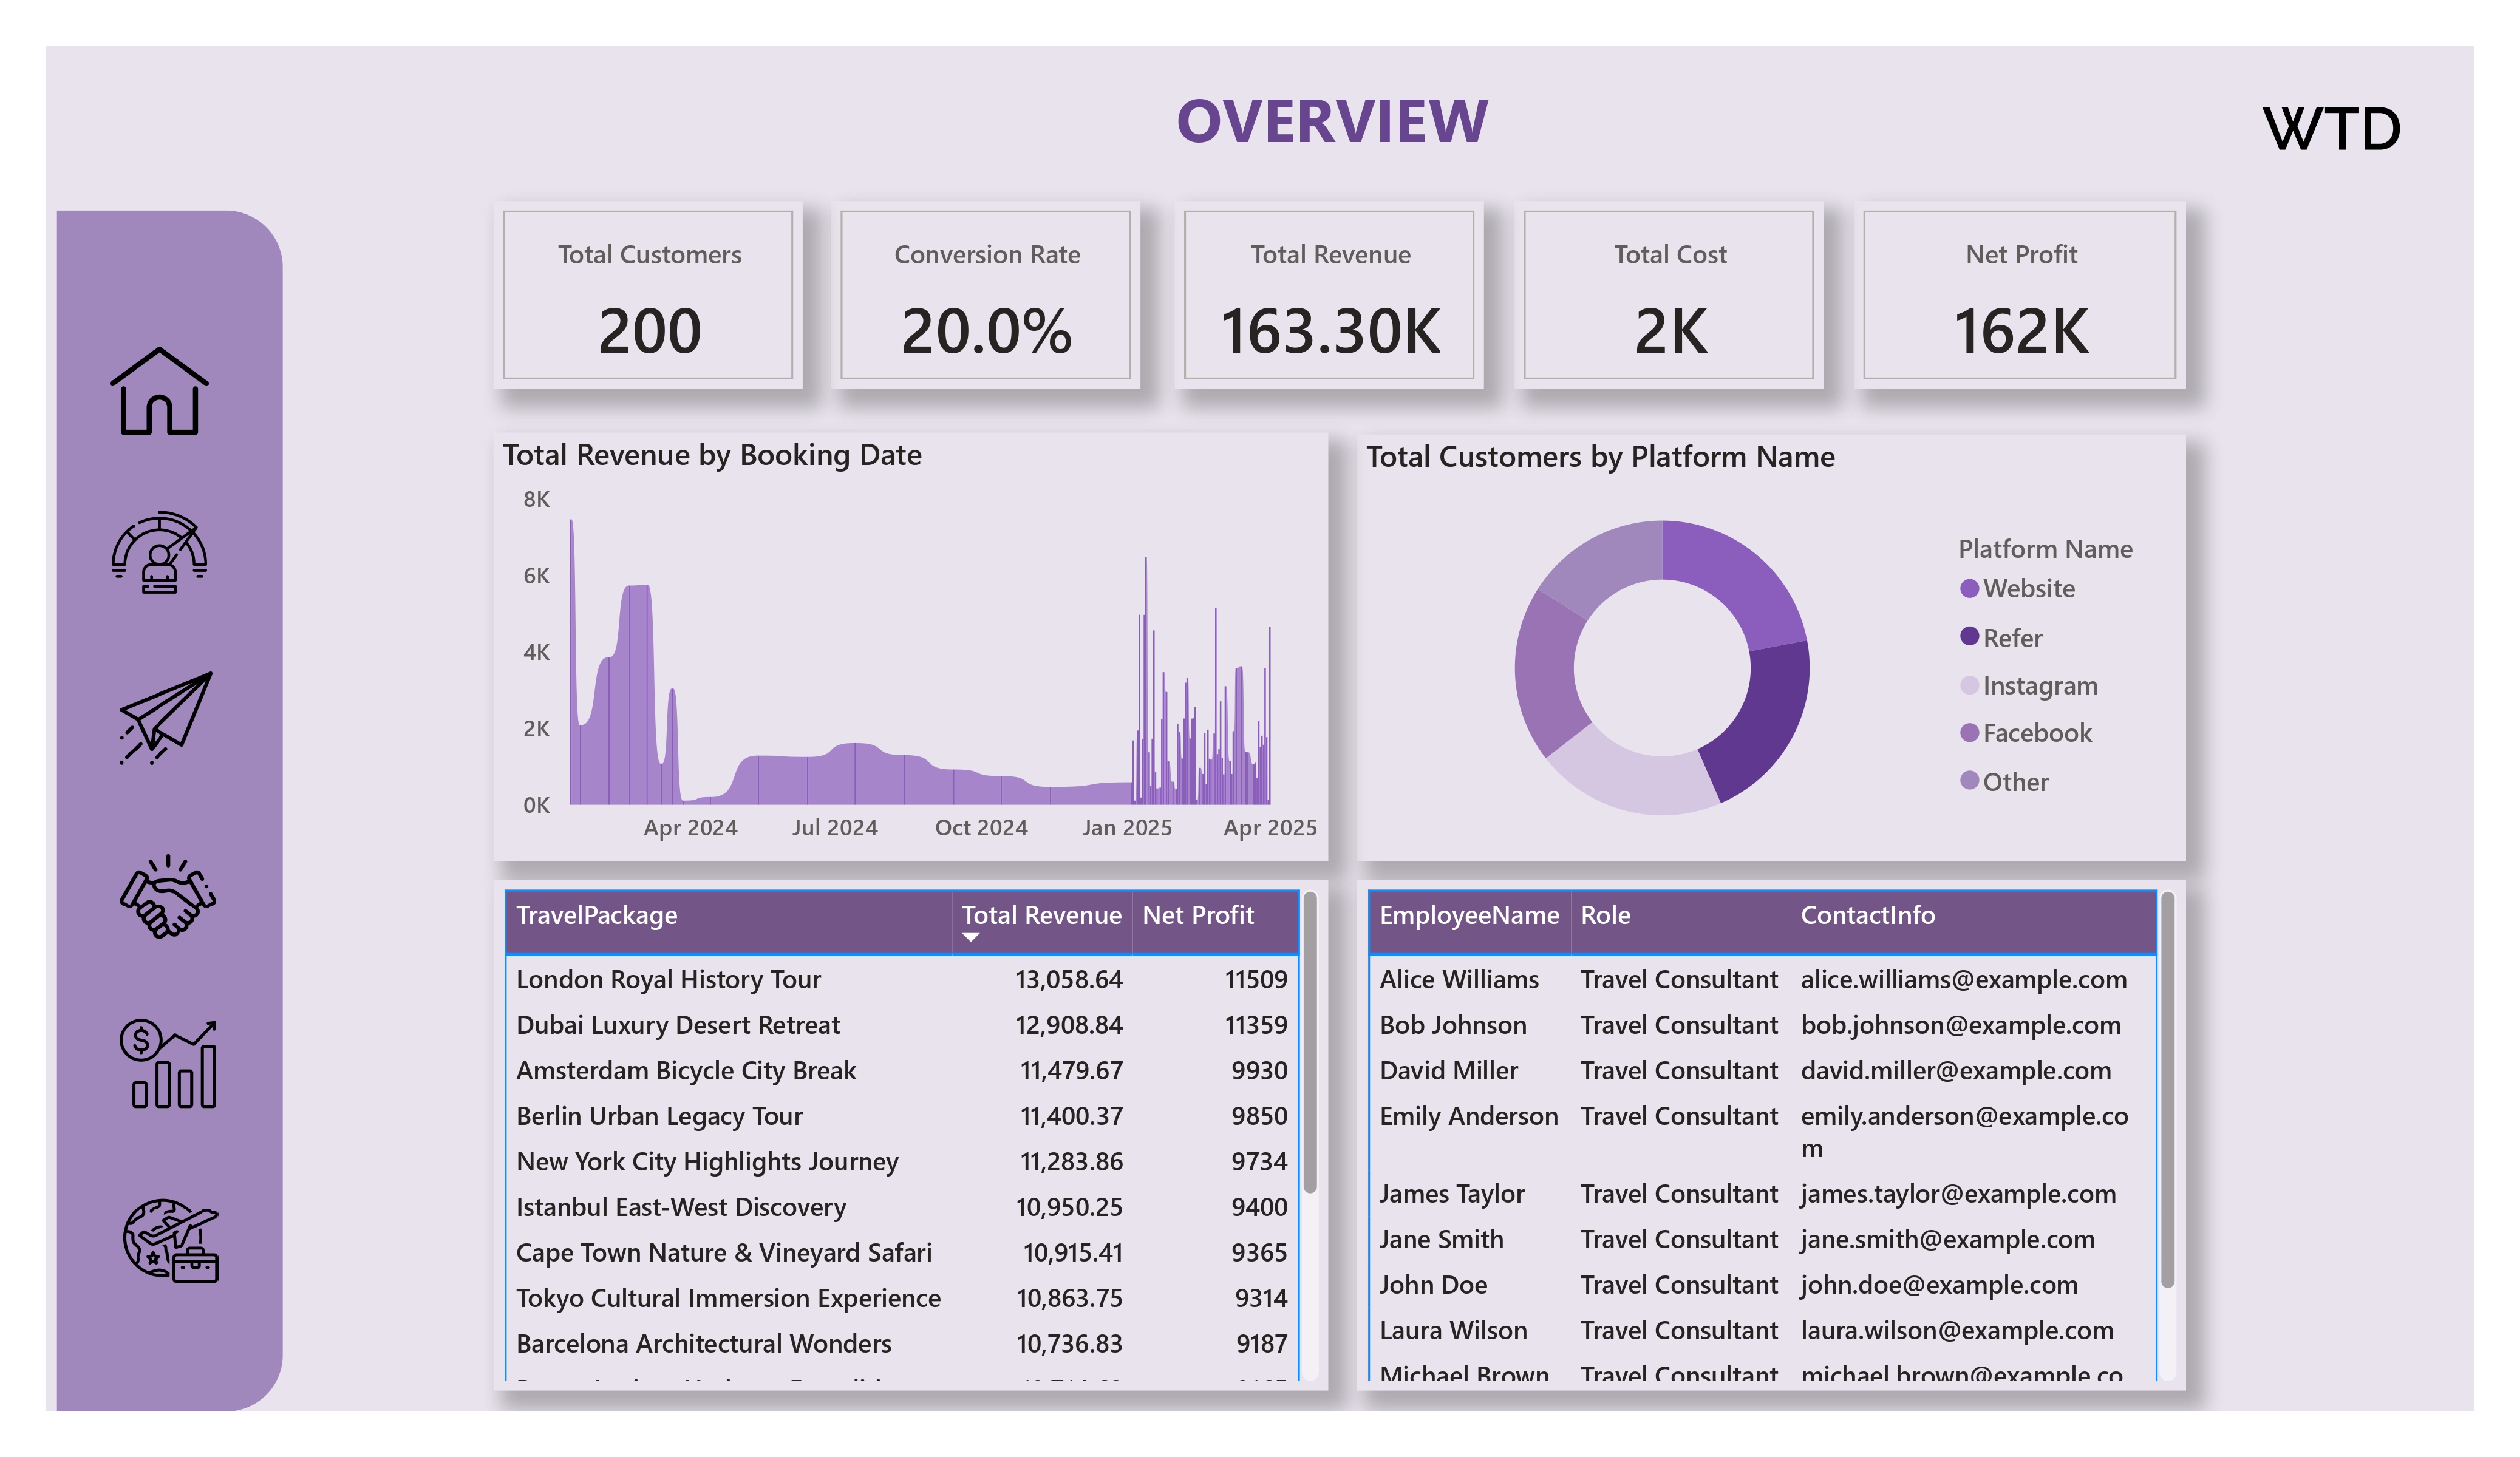
Overview
The Overview dashboard provides a high-level snapshot of your travel agency’s performance.
Key metrics include Total Customers, Total Bookings, Total Revenue, Total Cost, and Net Profit. It also features trends over time and customer distribution by platform, helping you quickly assess overall business health.
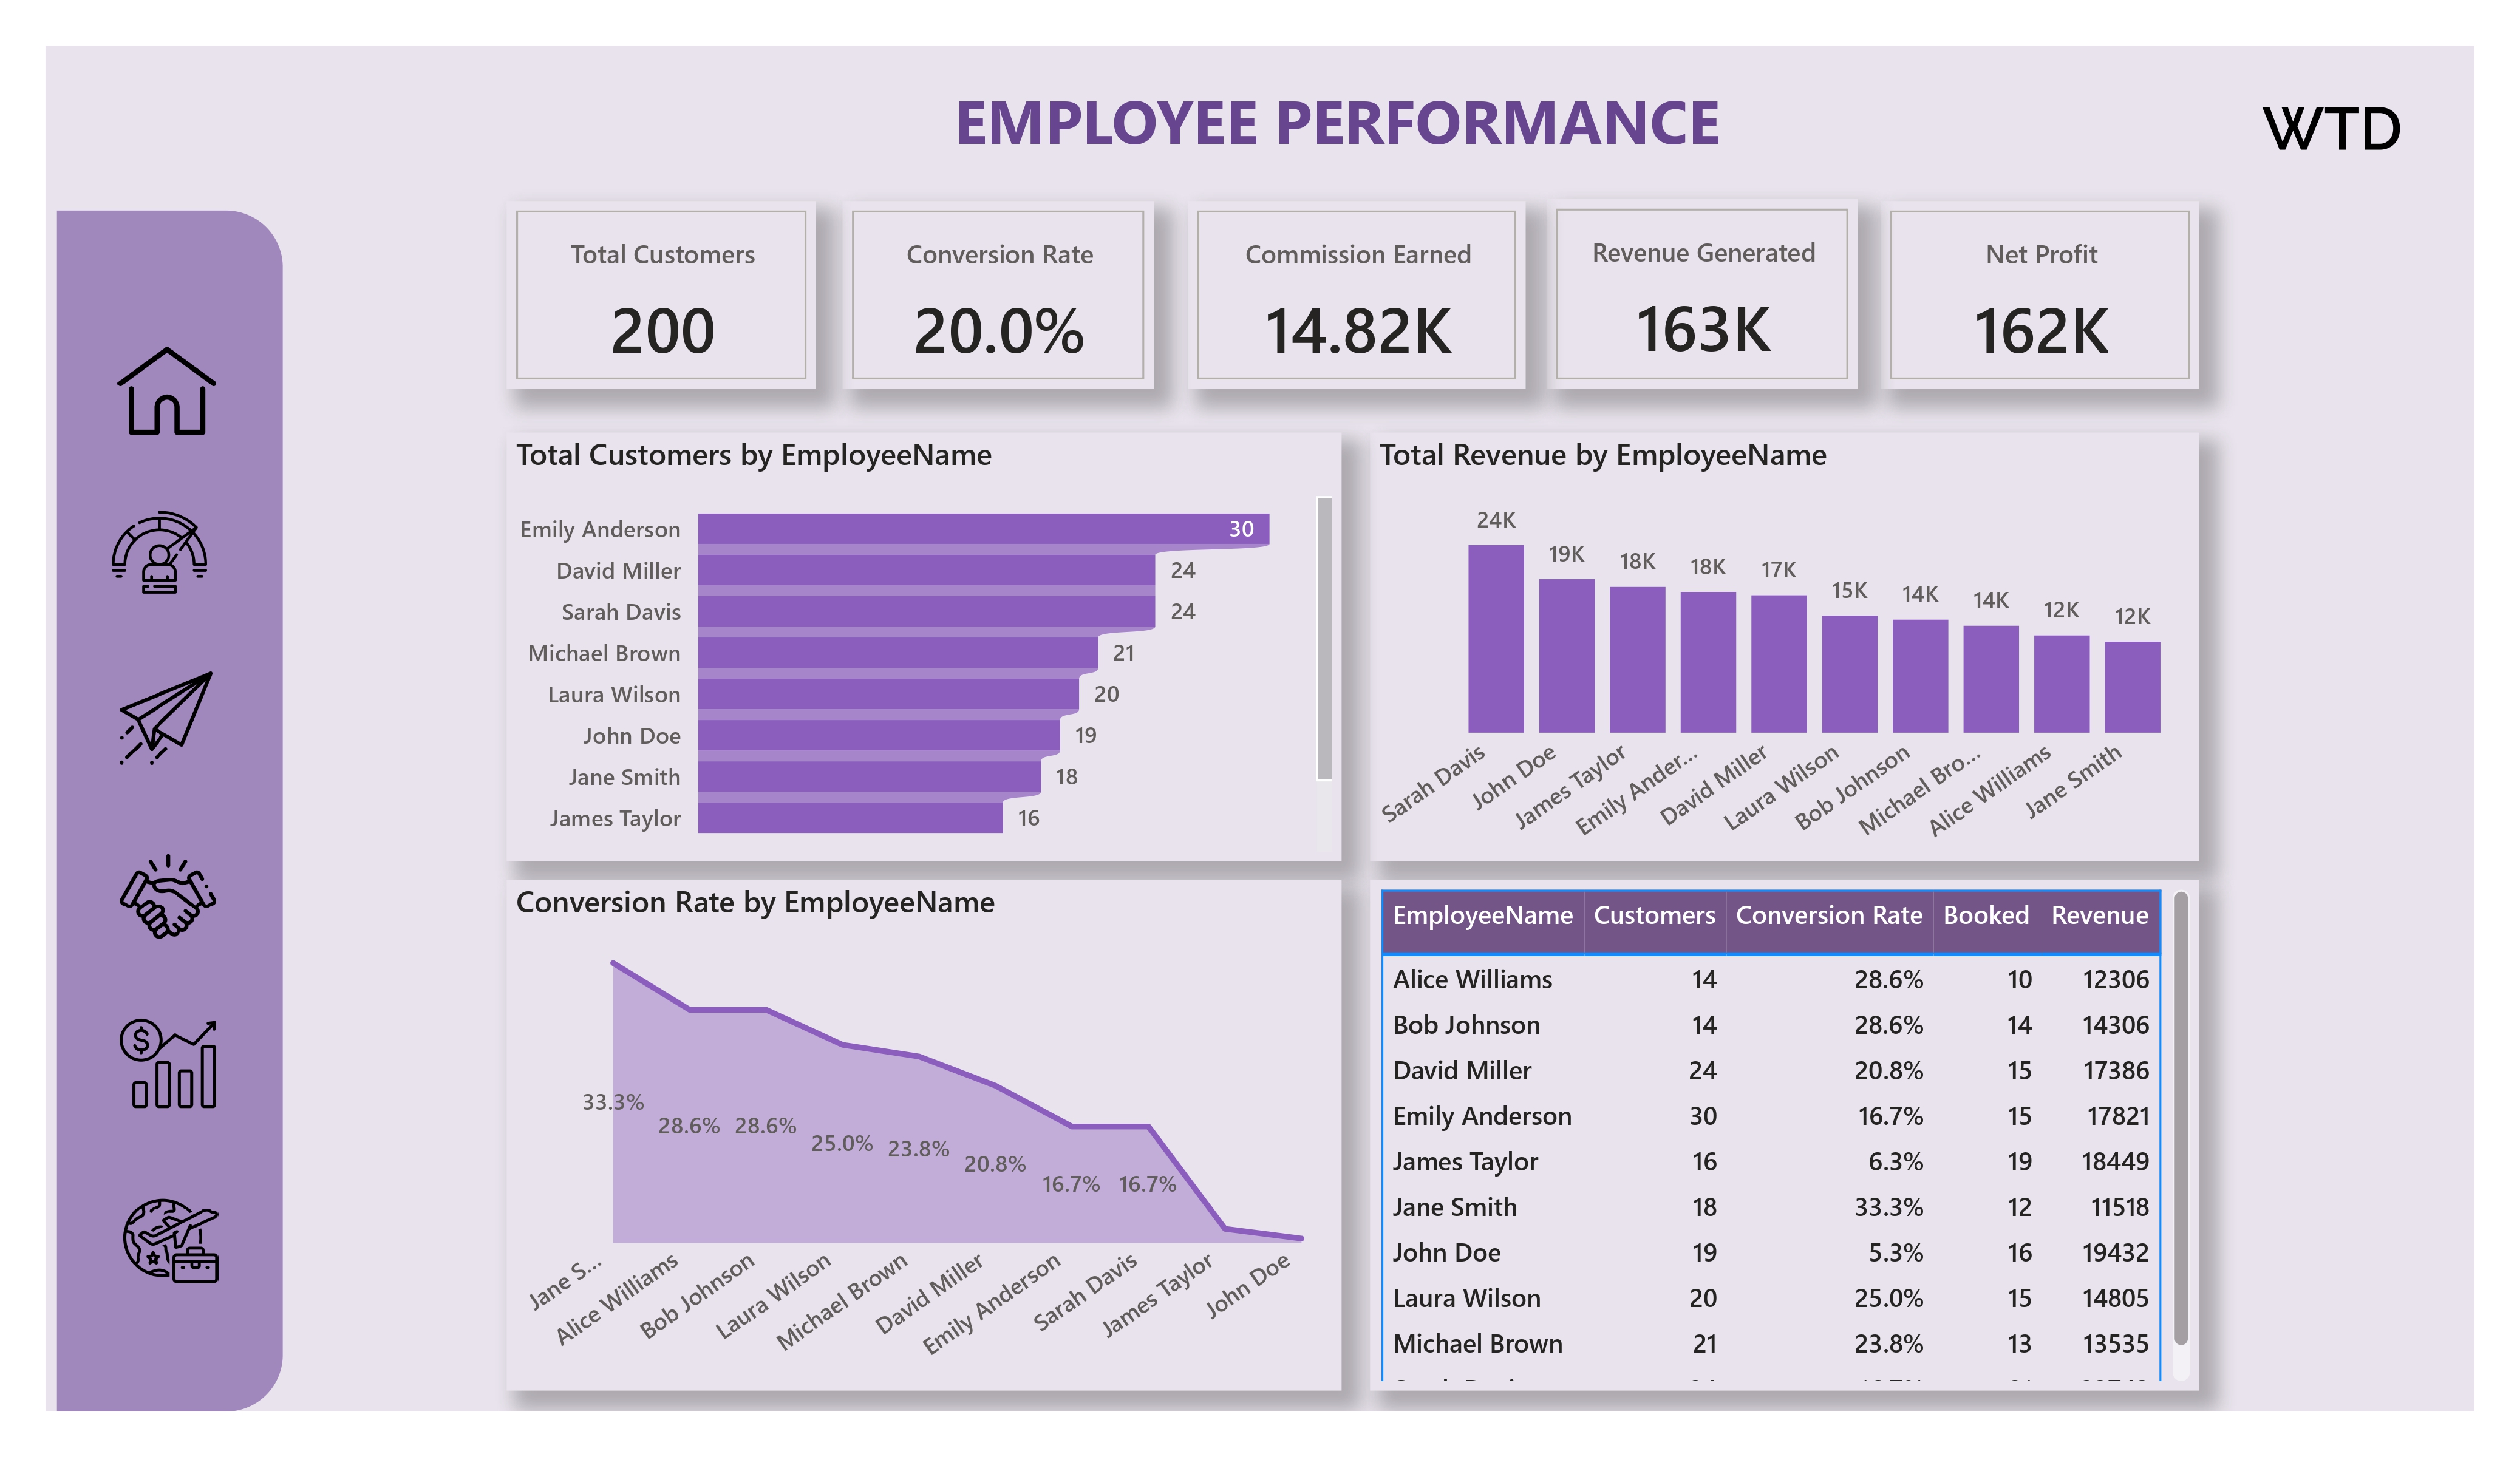
Employee Performance
The Employee Performance dashboard highlights individual employee contributions.
It includes metrics like Total Customers, Conversion Rate, Commission Earned, and Revenue Generated per employee. Visuals show performance trends, and a detailed table provides insights into each employee’s impact on sales.
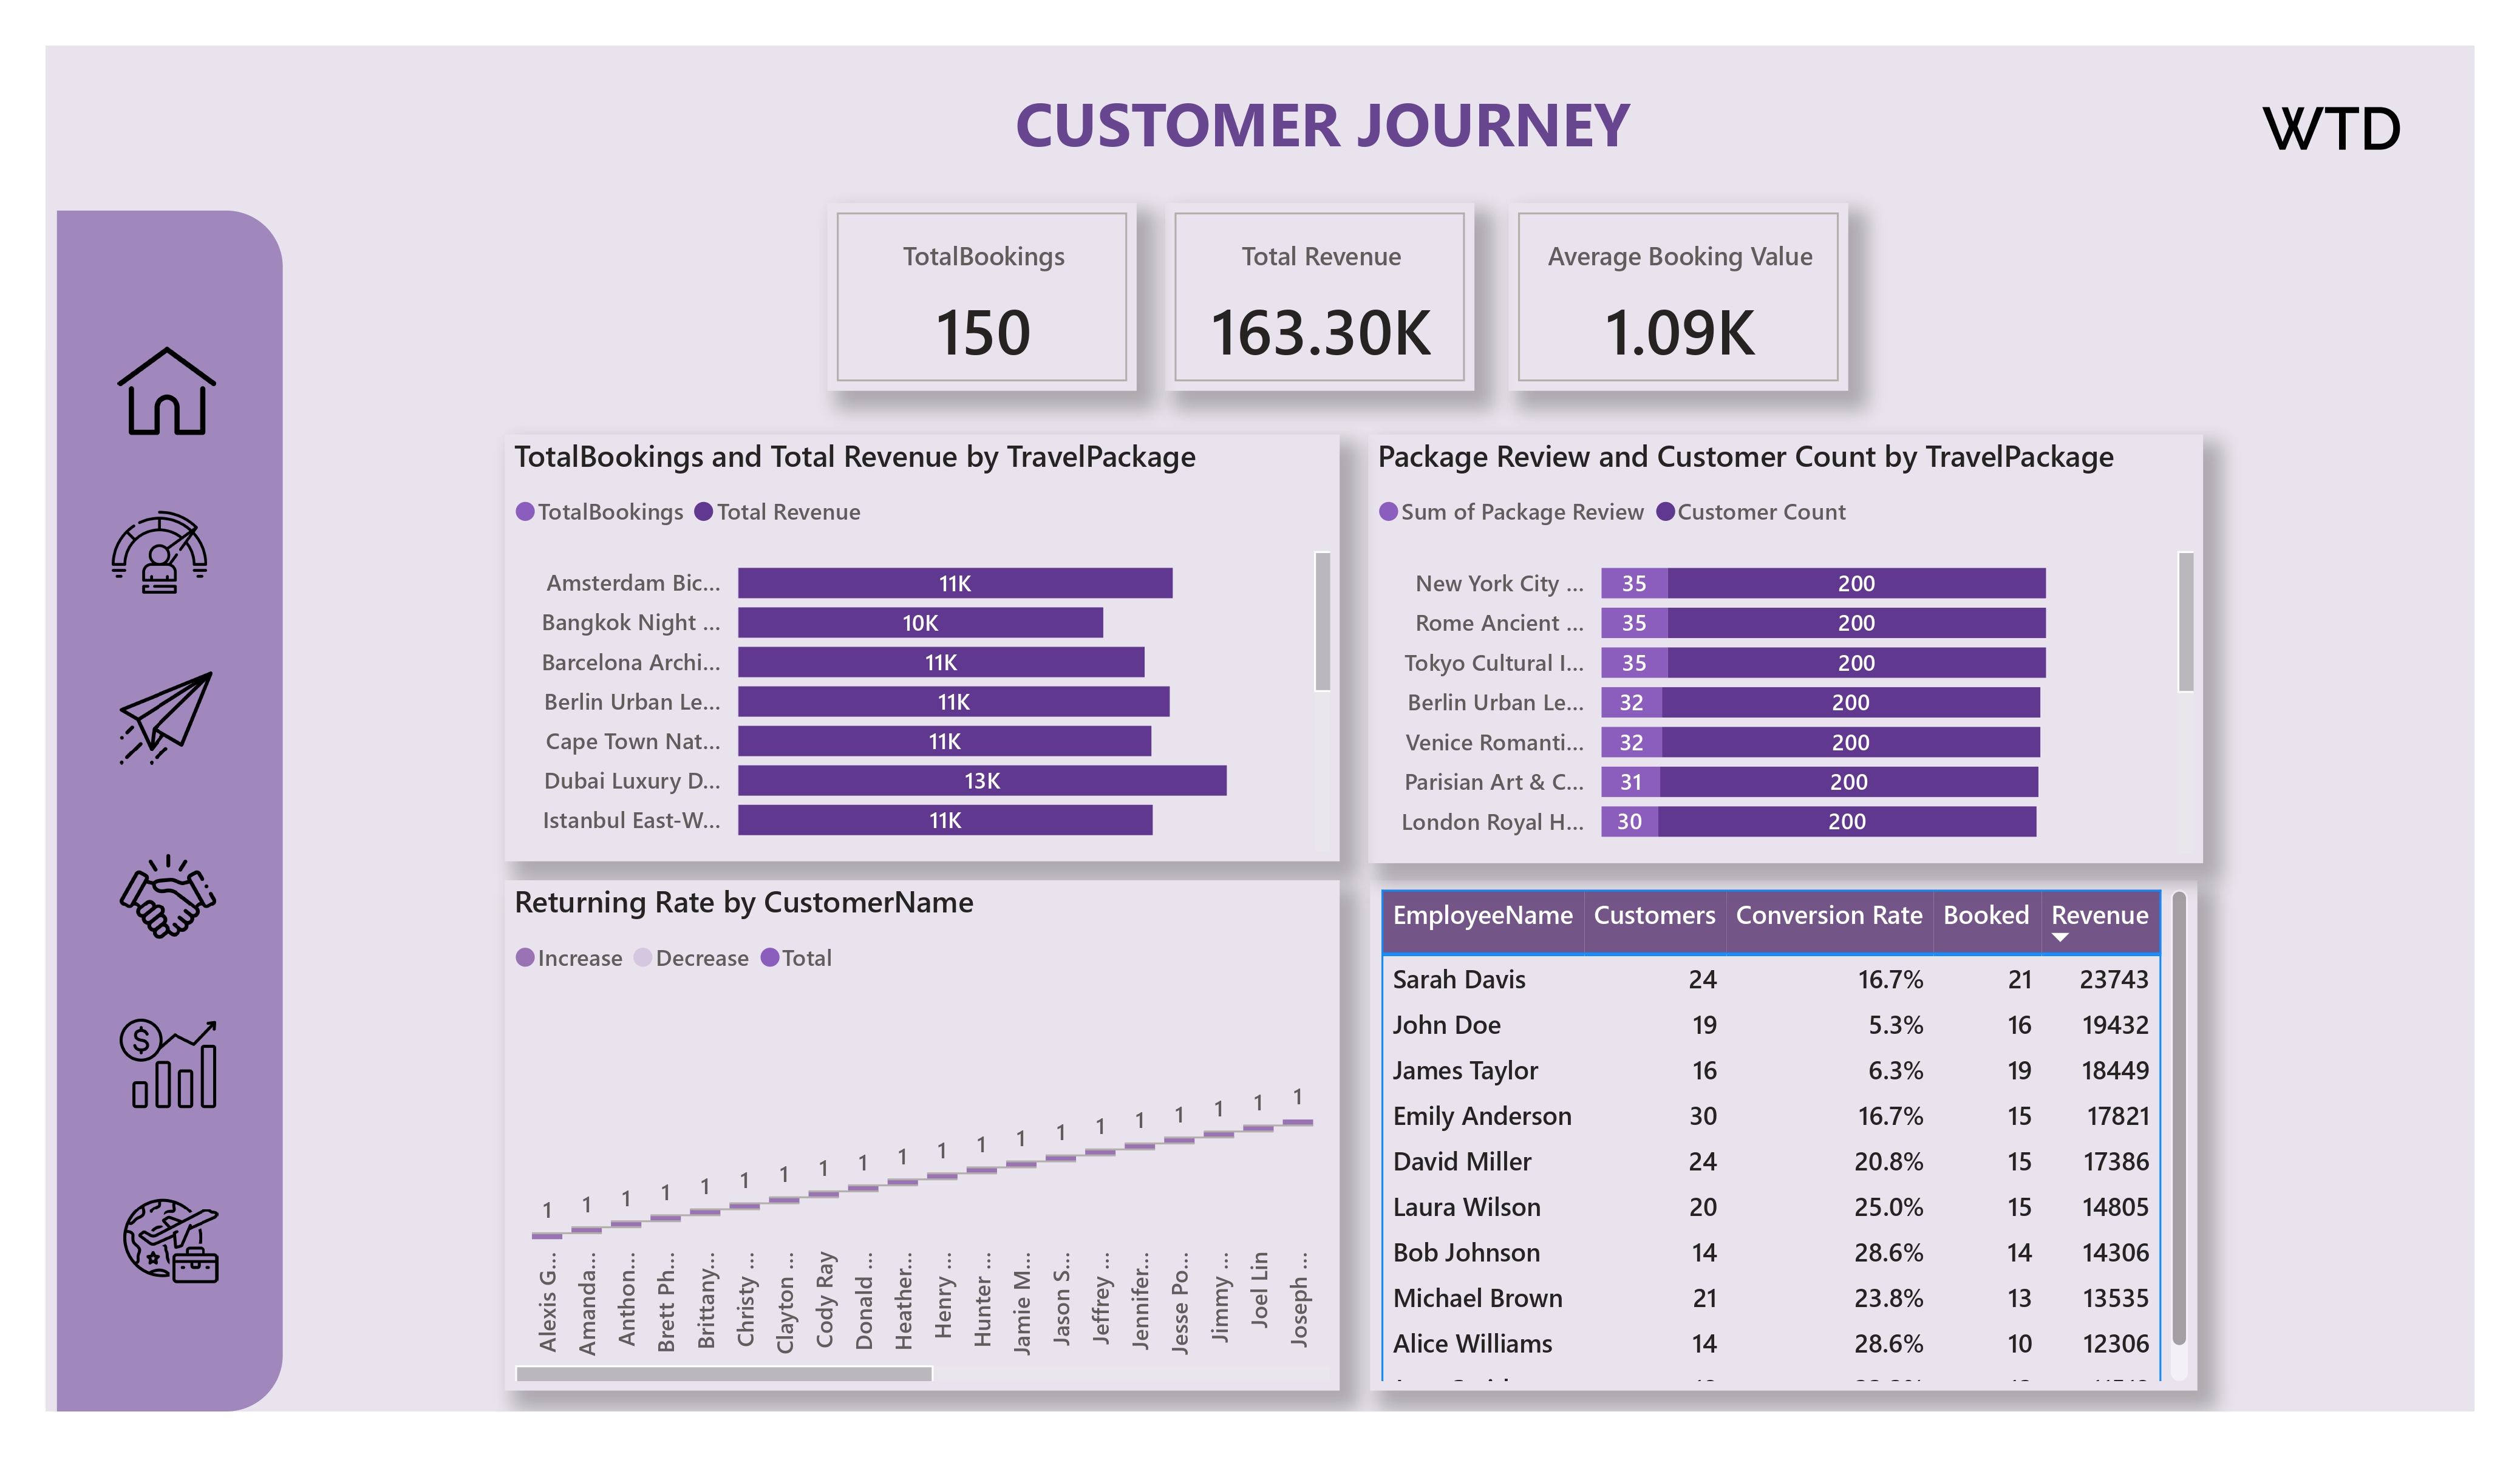
Customer Journey
The Customer Journey dashboard tracks the customer lifecycle from lead to booking.
Key metrics include Total Bookings, Total Revenue, and Average Booking Value . It features visuals like Total Bookings and Revenue by Travel Package, Conversion Rate by Employee, and Returning Rate, helping identify drop-off points and employee performance.
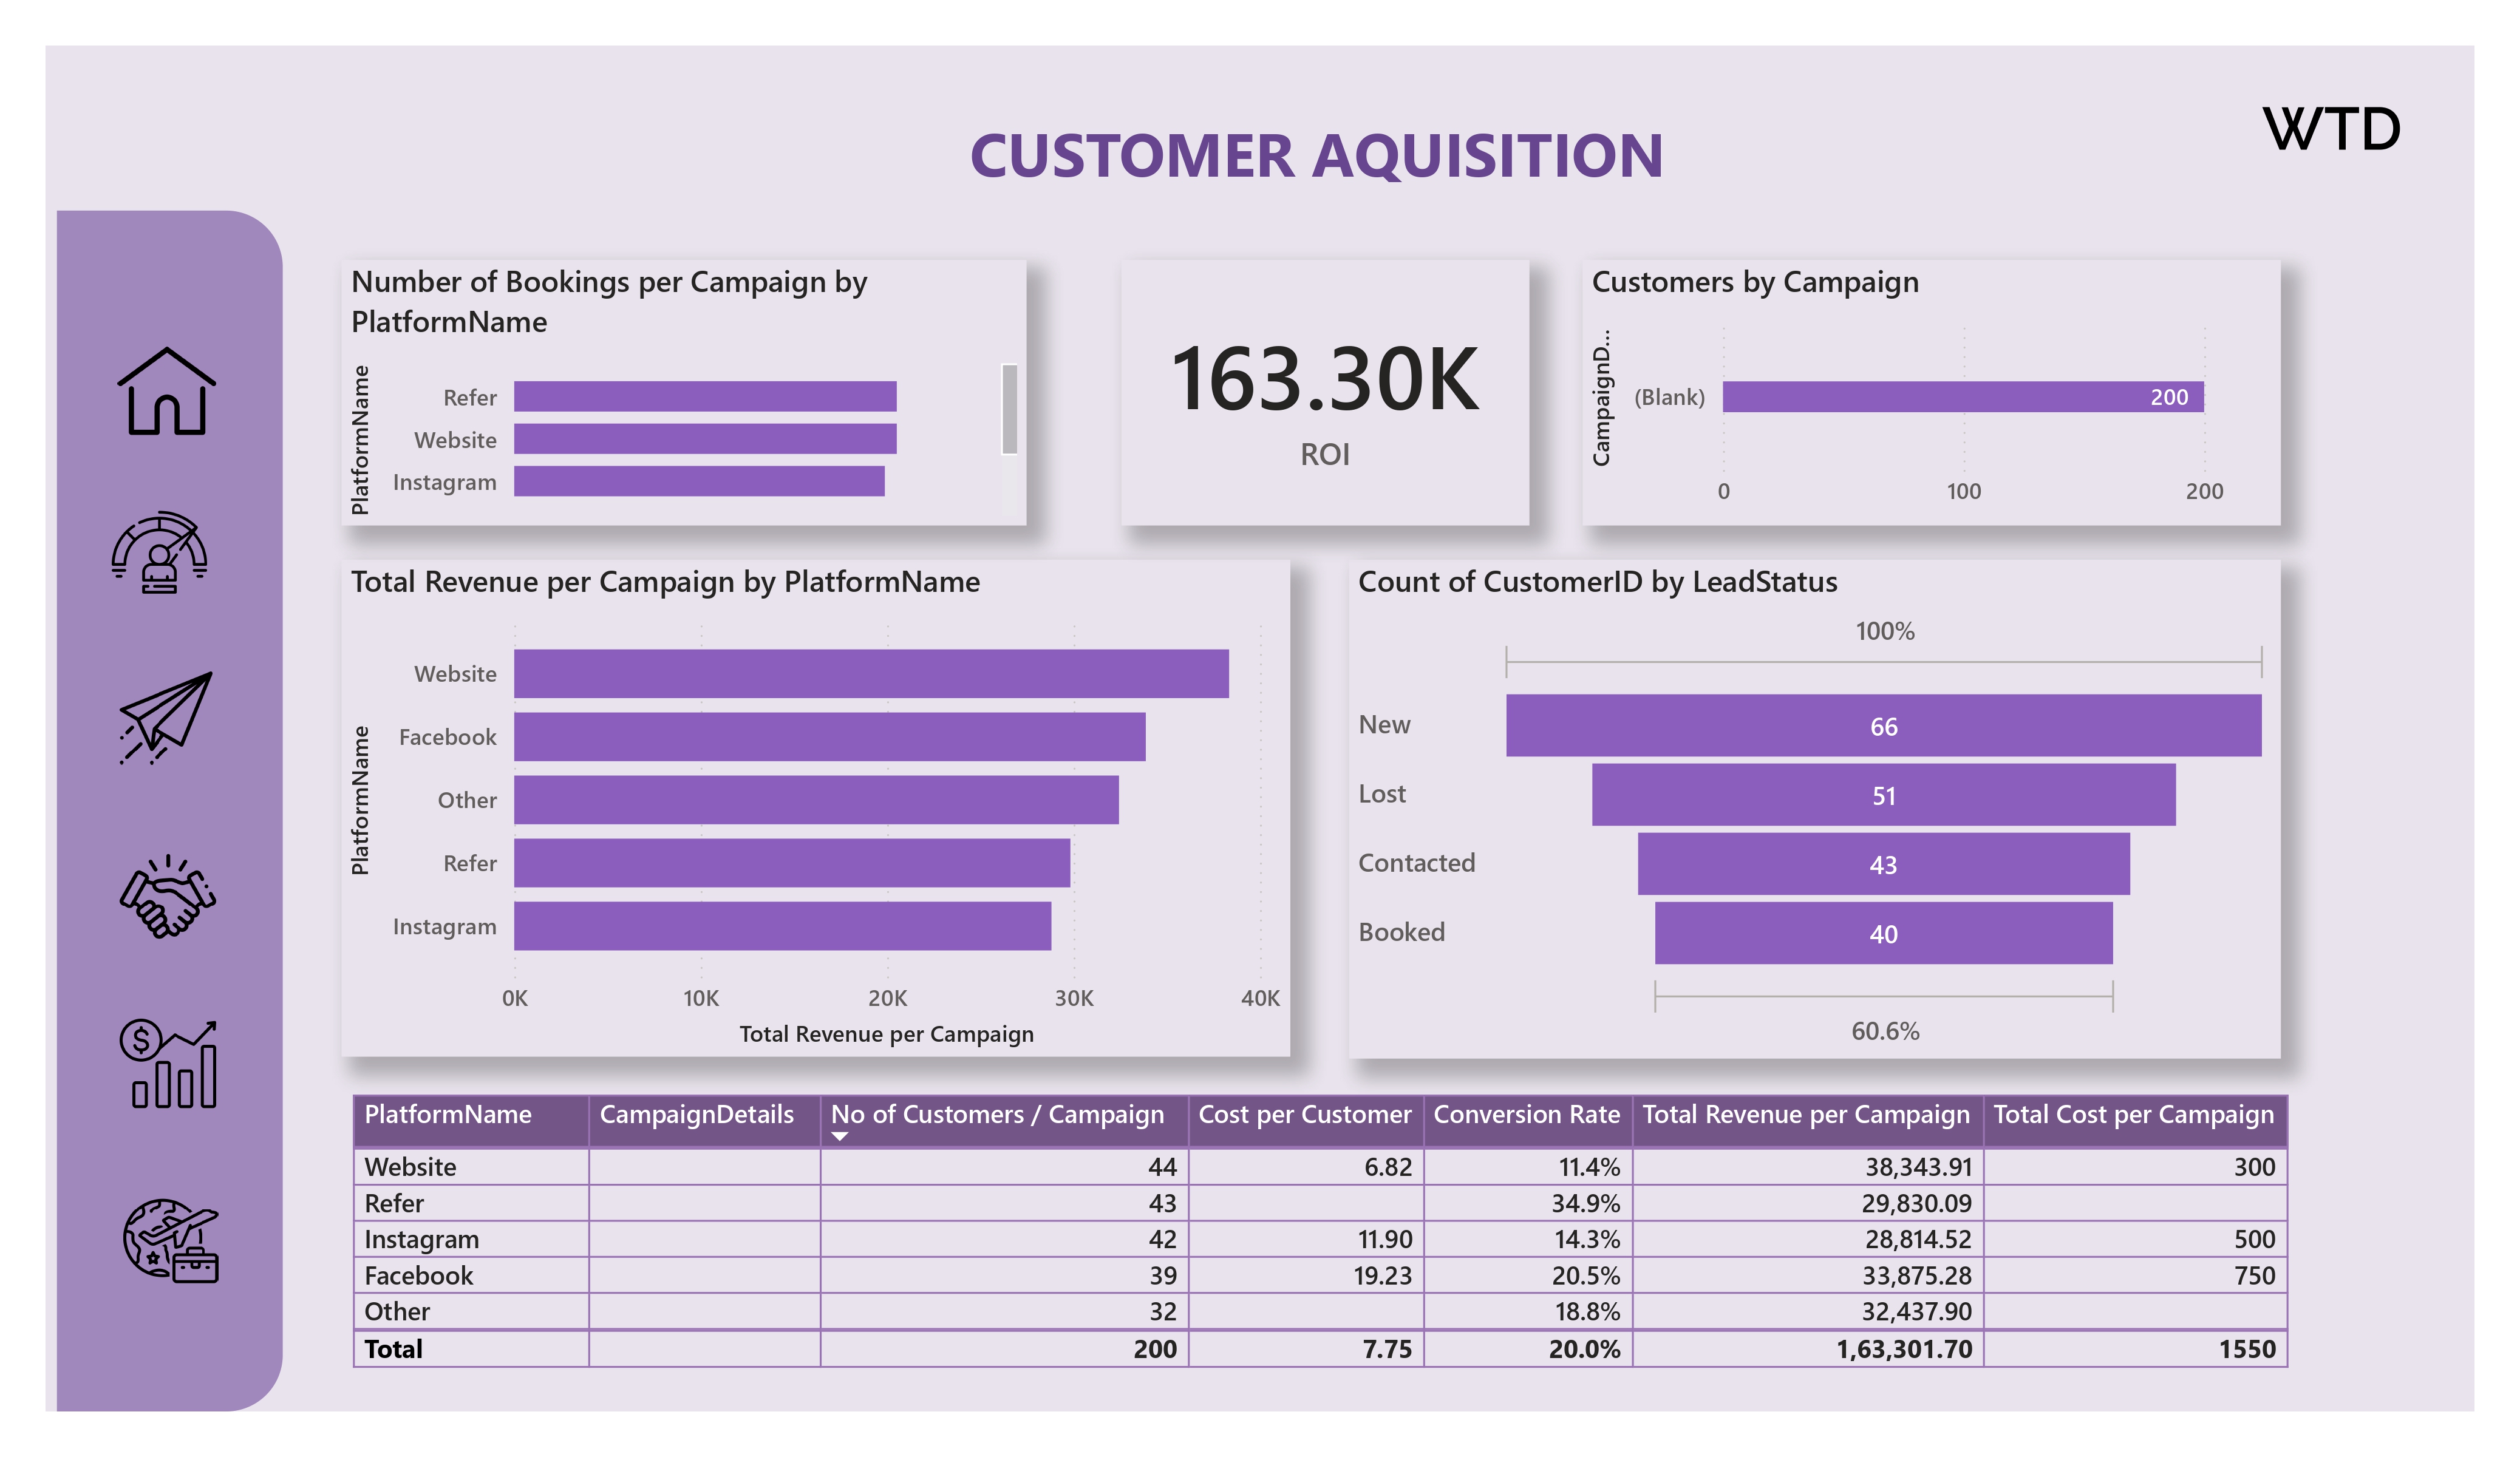
Customer Acquisition
The Customer Acquisition dashboard analyzes how customers are acquired through campaigns.
It includes Number of Bookings and Total Revenue per Campaign by Platform (e.g., Website, Facebook, Instagram). A detailed table shows Customers, Cost per Customer, Conversion Rate, Total Revenue, and Total Cost, enabling optimization of marketing strategies.
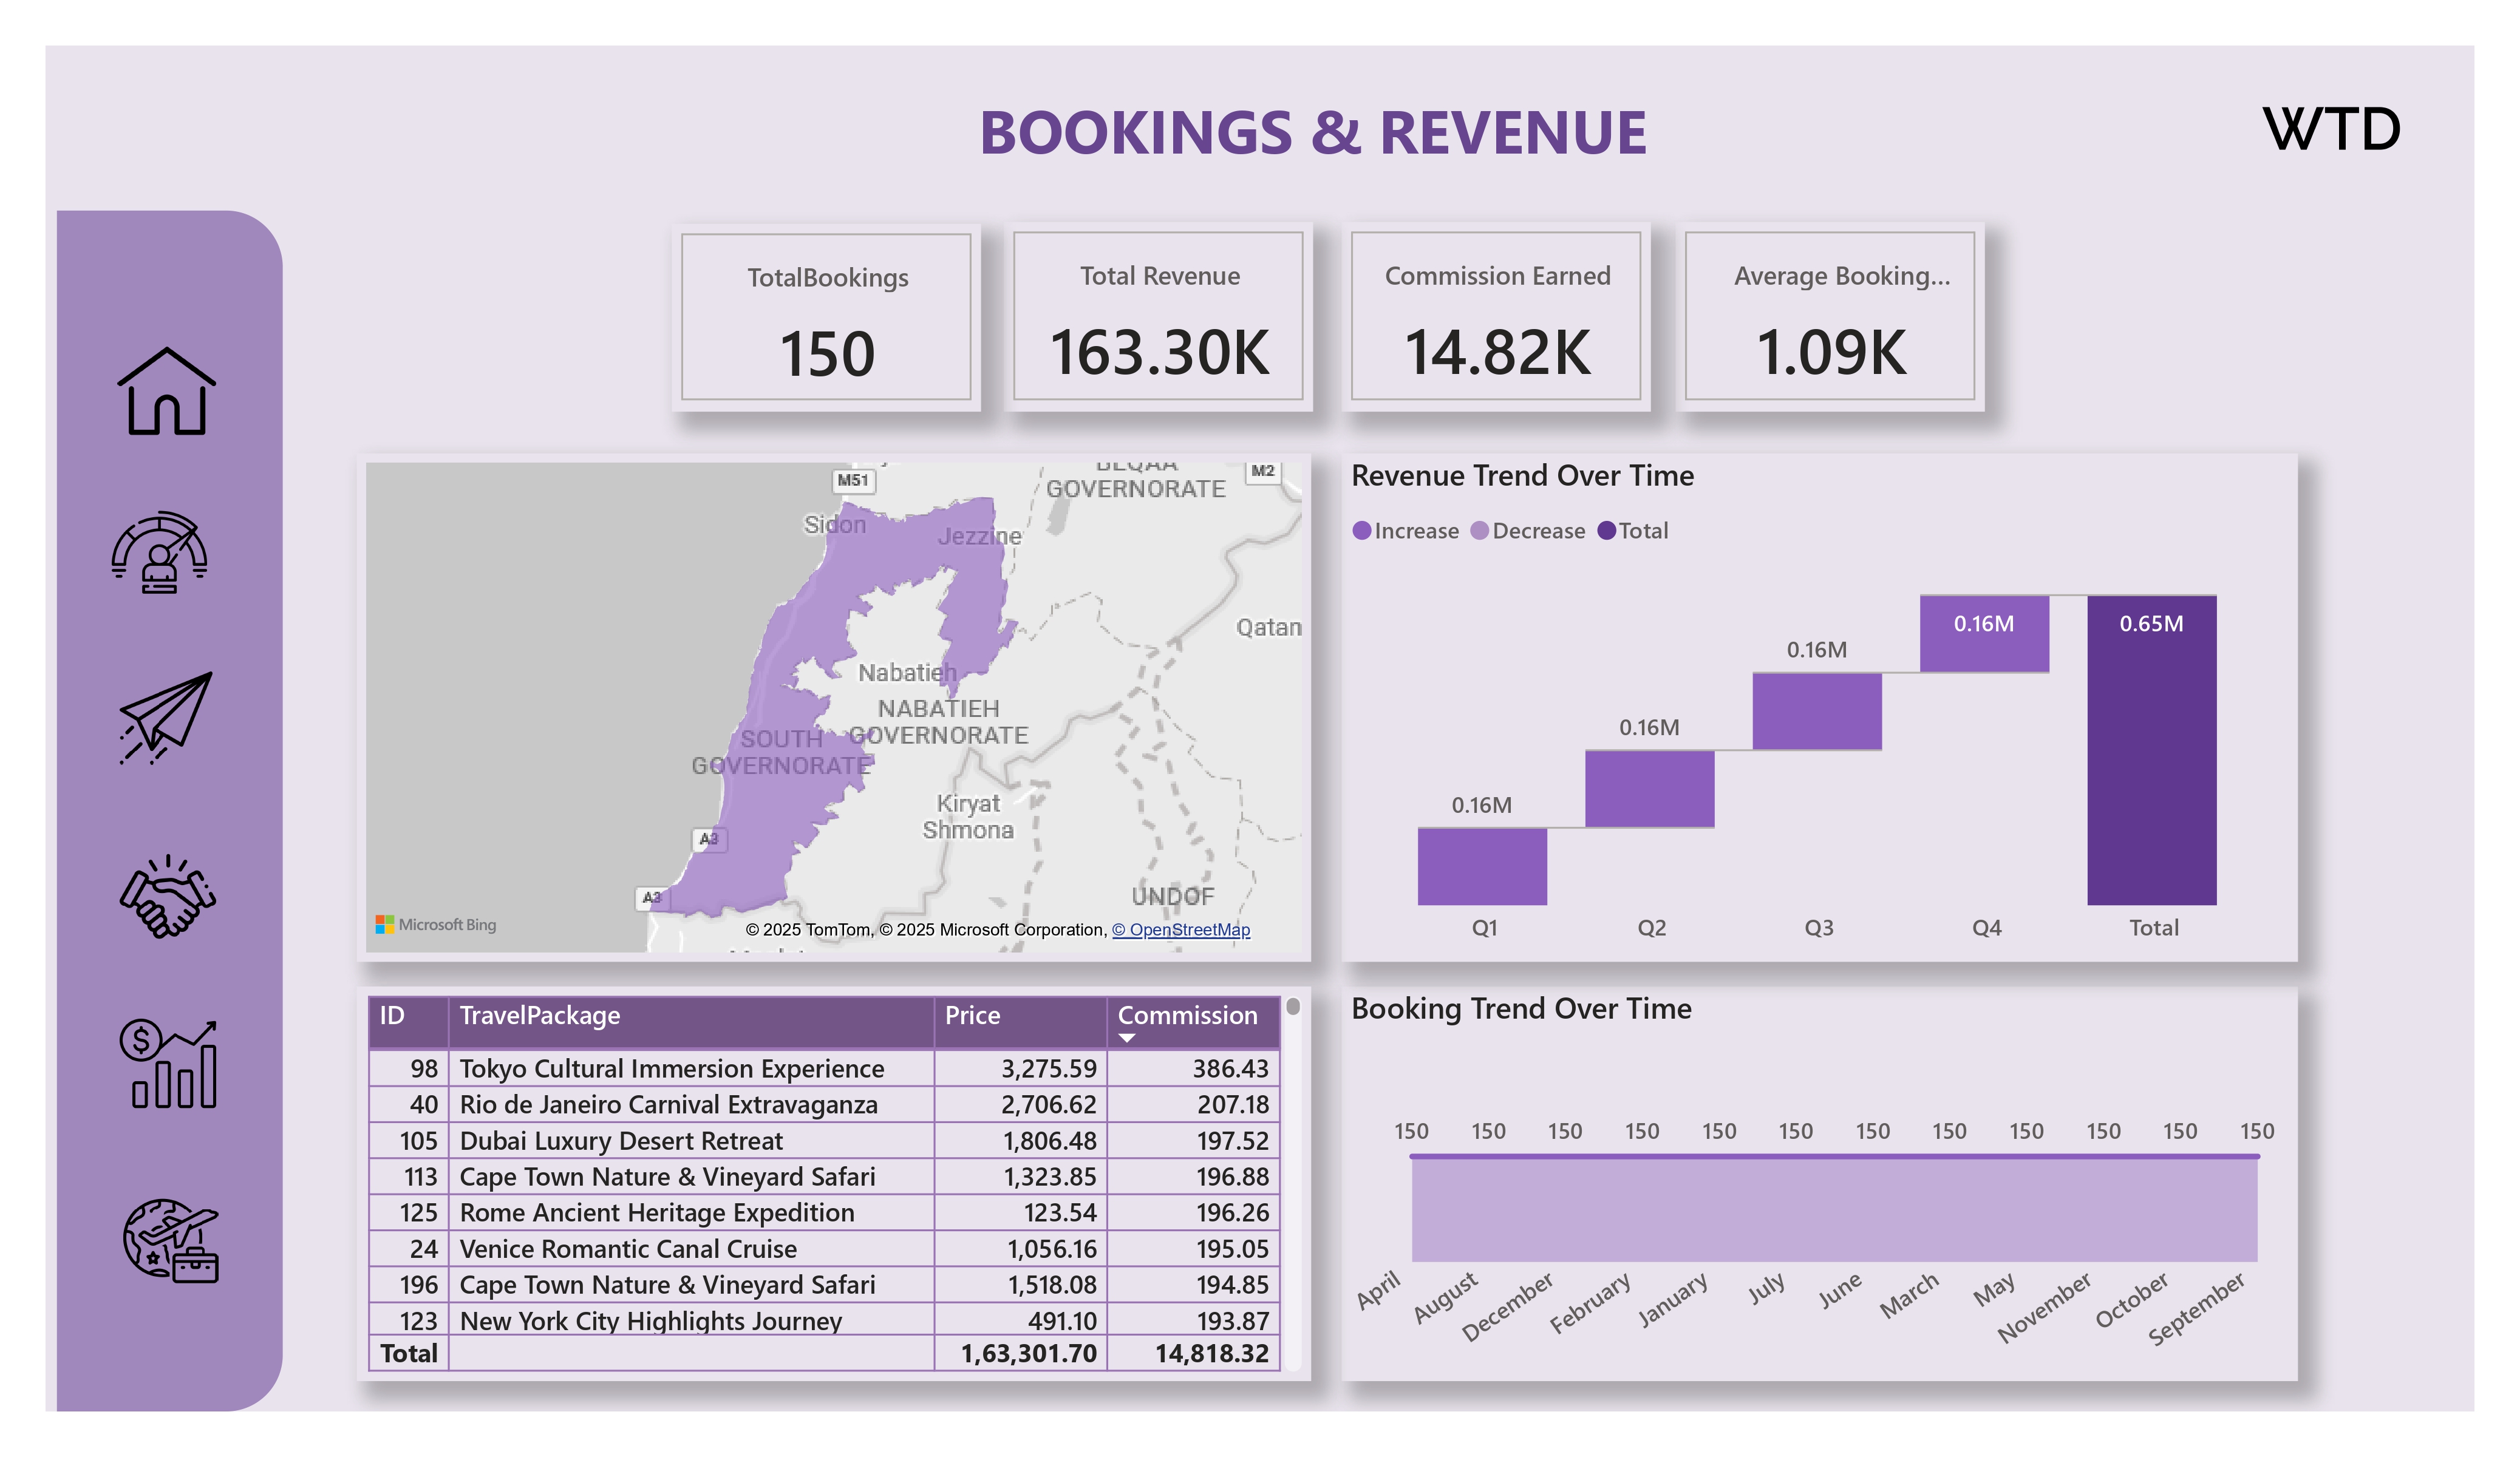
Bookings & Revenue Section
TThe Bookings & Revenue dashboard provides insights into sales performance.
Key metrics include Total Bookings, Total Revenue, Average Booking Value, and Commission Earned. It features a revenue trend over time, a detailed bookings table, and a map visual showing revenue by location (Country > State hierarchy), helping identify high-performing regions.